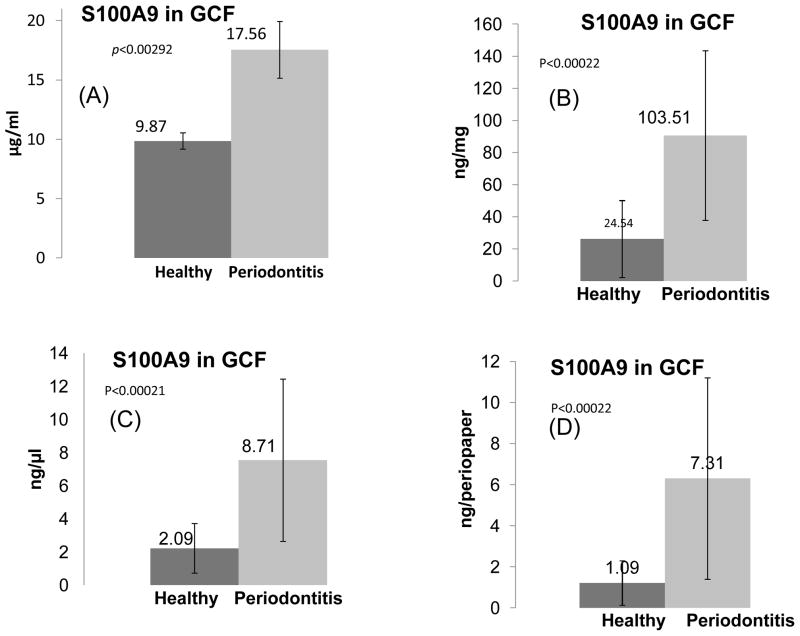
Figure 4. ELISA of S100A9 protein in GCF of healthy individuals and those with periodontal disease.
(A), ELISA of S100A9 in pools of GCF from 40 healthy subjects and 40 periodontal patients were used as described for albumin in Figure 3 and demonstrated in Figure 1, Panel 1. (B), ELISA of S100A9 in each of the 40 GCF of healthy and 40 periodontal disease, all individually analyzed and normalized per mg of protein. (C), ELISA of S100A9 in each of the 40 GCF of healthy and 40 periodontal disease all individually analyzed and normalized per μl of GCF volume. (D), ELISA of S100A9 in each of the 40 GCF of healthy and 40 periodontal disease, all individually analyzed and normalized per GCF periopaper. The variation within each group is shown with standard deviation. The student t-test showed that the two sets of data, disease versus control, are different and these were statistically significant with p values as noted within the Figures.

