Figure 3.
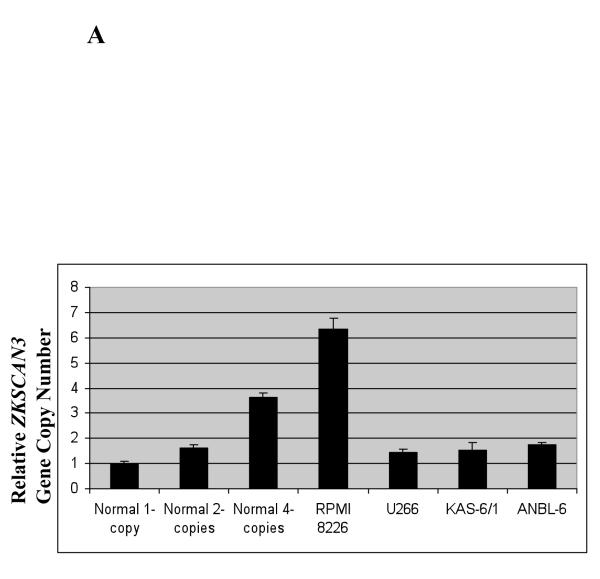
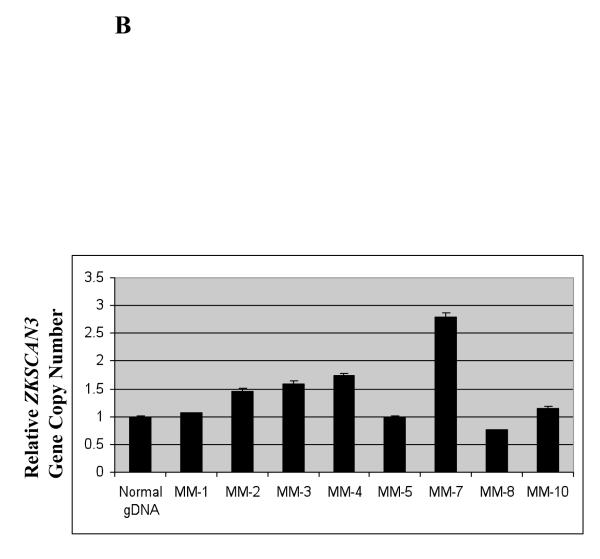
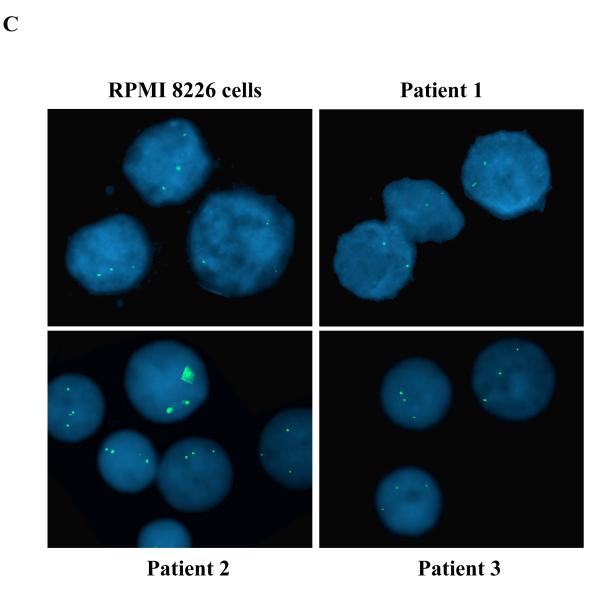
Gene copy number increases contribute to ZKSCAN3 overexpression.
(a) Multiple myeloma cell lines expressing ZKSCAN3 at the mRNA and protein level were evaluated for gene copy number using qPCR. The mean gene copy number plus or minus the standard deviation from experiments performed in triplicate are shown in comparison to controls.
(b) ZKSCAN3 gene copy number analysis was performed on the same patient samples used in Figure 1C as described above, and the results are expressed in relation to normal genomic DNA (gDNA) as a control.
(c) FISH was performed to analyze ZKSCAN3 gene copy number using RPMI 8226 cells as a positive control (upper left panel), and KAS-6/1 cells as a negative control (data not shown). Out of ten primary patient samples analyzed, eight revealed a normal signal with two copies of the locus of interest, of which one representative sample is shown (upper right panel). Two myeloma samples consisted of a significant proportion of cells with three signals per cell (lower right and left panels).


