Figure 5.
Suppression of ZKSCAN3 reduces cyclin D2 and myeloma proliferation.
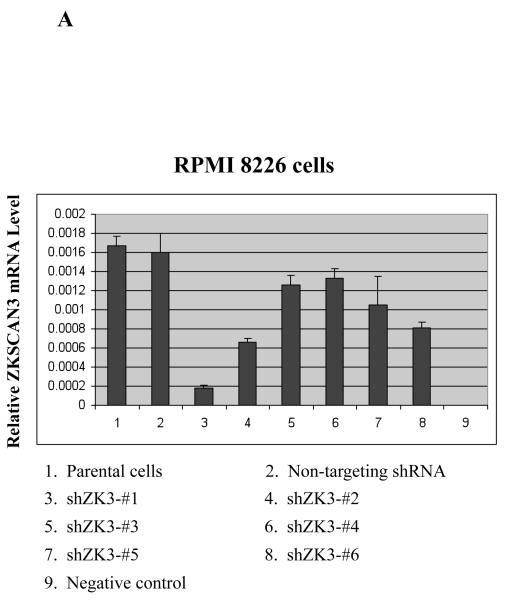
(a) RPMI 8226 cells were infected with Lentiviral particles containing either a control shRNA construct (Non-targeting shRNA), or one of six ZKSCAN3 shRNAs designed using the Dharmacon Custom siRNA Design Tool. Transduced cells were sorted for GFP positivity, and ZKSCAN3 mRNA levels were then determined by qPCR. These are expressed as the mean plus or minus the standard deviation from three experiments, with mock-treated parental RPMI 8226 cells, and GAPDH used as controls.
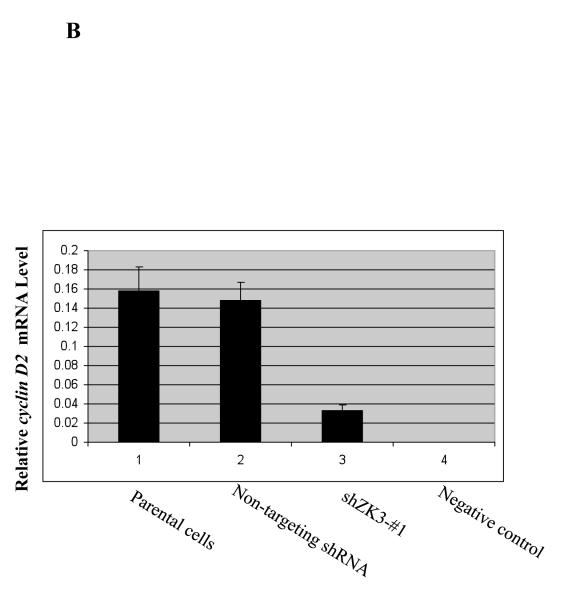
(b) Expression levels of cyclin D2 mRNA were determined in the above cells by qPCR, and were normalized and expressed as indicated.
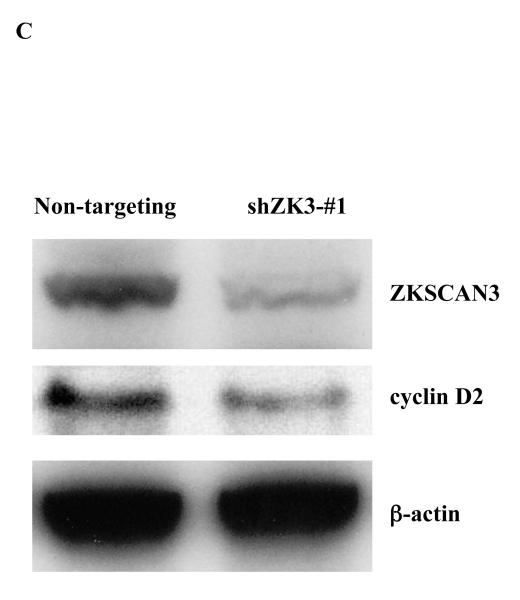
(c) cyclin D2 and ZKSCAN3 protein levels were evaluated in RPMI 8226 cells infected as above with either non-targeting Lentiviral particles, or particles inducing expression of shZK3-#1.
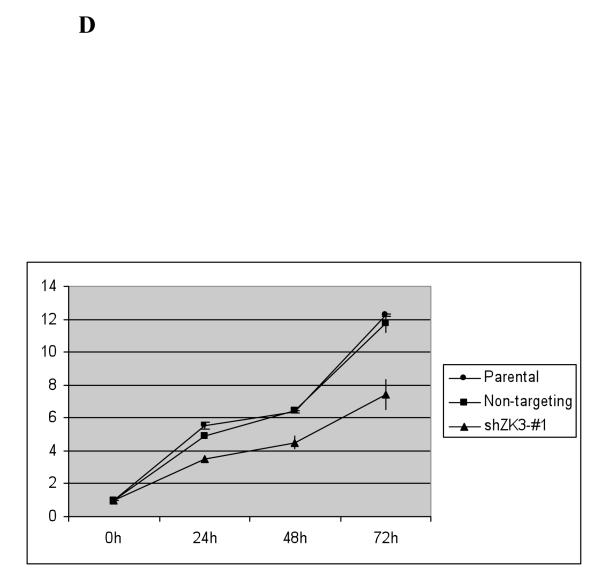
(d) Proliferation of RPMI 8226 cells infected with the above Lentiviral particles was evaluated every 24 hours over four time points using the tetrazolium salt WST-1. The mean absorbance at each time point is indicated in comparison with media only controls plus or minus the standard deviation from triplicate experiments.
(e) Cell cycle profiles were obtained in RPMI 8226 cells transduced with either shZK3-#1 or shNon-trageting controls, by staining with propidium iodide followed by FACS analysis. A total of 20,000 events were collected from each of three replicate experiments, and differences in cell cycle distribution determine using FlowJo software (Tree Star, Inc., Ashland, OR) were compared using the student’s t-test.


