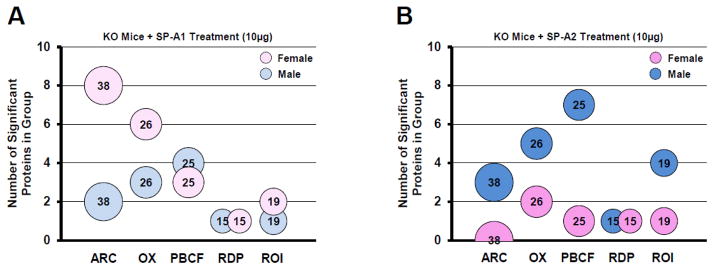
Figure 6.

Changes in functional groups with each SP-A gene product. Bubble charts depicting the number of significantly different proteins per group: ARC, actin-related cytoskeletal; OX, oxidative stress; PBCF, protease balance/chaperone function; RDP, regulatory/developmental processes, and ROI, regulation of inflammation. Bubble size and the number within each bubble indicate the number of proteins in the overall group. The number of significant differences is indicated by the y-axis values. Panel A shows groups from KO mice treated with SP-A1 (10μg) for males (light blue) or females (light pink). Panel B shows groups from KO mice treated with SP-A2 (10μg) for males (dark blue) or females (dark pink).
