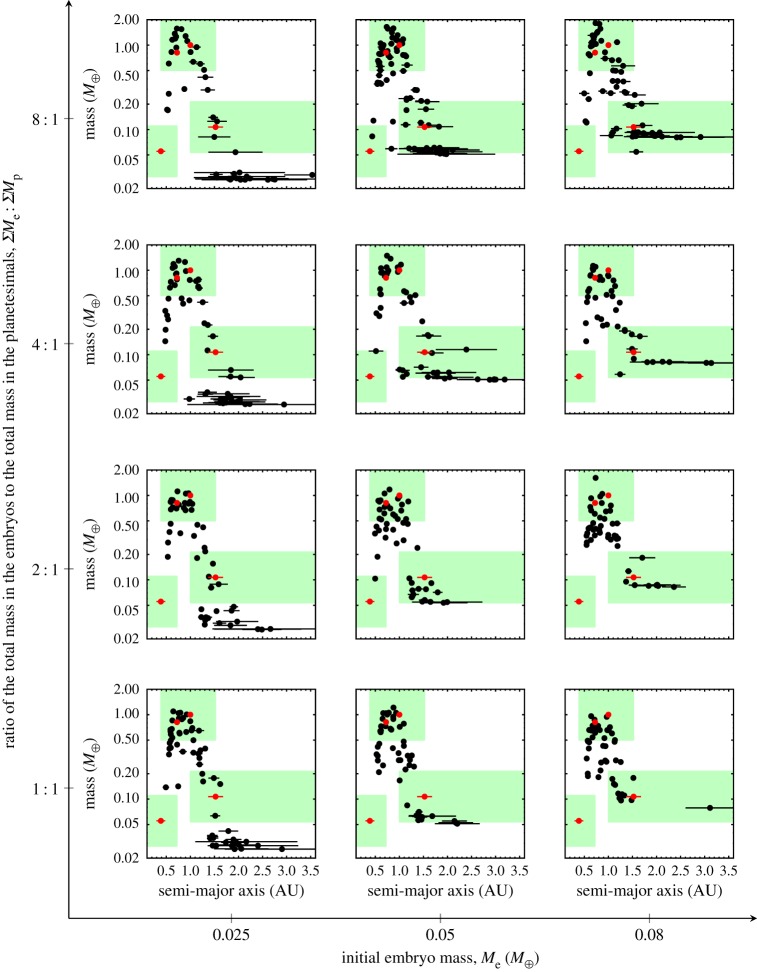
Figure 1.
Each sub-panel shows planets from simulations that started from a different suite of initial conditions. The sub-panels are arranged according to initial embryo mass Me and the initial ratio between the total masses of embryos and planetesimals (ΣMe:ΣMp). Within each sub-panel, the mass of every planet from each simulation suite is shown as a function of semi-major axis. Each black dot locates the planet at its semi-major axis, and the black line shows its perihelion-to-aphelion excursion. Red (grey) dots show the real masses of Mercury, Venus, Earth and Mars, and the red (grey) lines show the width of their radial excursions. The shaded boxes highlight the regions that correspond to Mercury, Earth and Mars analogues. (Online version in colour.)

