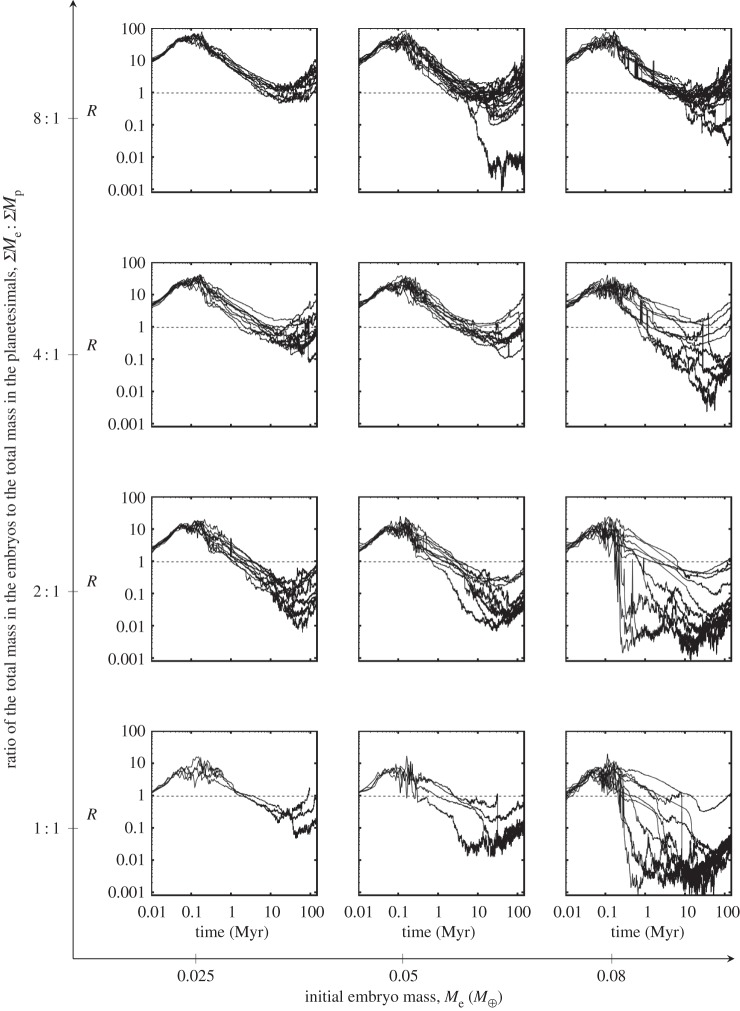
Figure 9.
The relative angular momentum deficit of the embryo to the planetesimal populations for each simulated Solar System. We only have angular momentum evolution data for the Walsh et al. [31] simulations and not for the O'Brien et al. [11] simulations, so there are fewer 1:1-0.025 and 1:1-0.05 simulations. The primary plot and the inset share identical data; however the time is shown logarithmically in the primary plot but linearly in the inset. The sub-panels are arranged the same as in figure 1.

