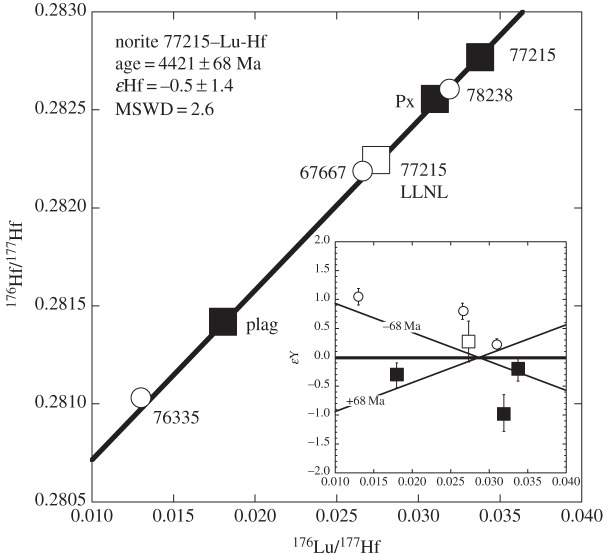
Figure 3.
Lu-Hf isochron diagram for 77215 minerals and whole rock (squares) and other Mg-suite samples (circles). The open square denotes the 77215 whole rock sample measured at LLNL. The inset shows deviations of the data, in parts in 10 000 from the 77215 internal isochron. Only the data for 77215 are used to determine the lines shown in the figure.

