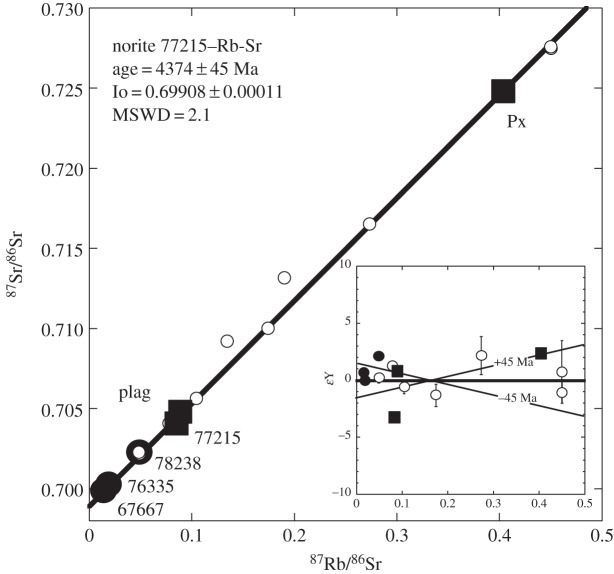
Figure 4.
Rb-Sr isochron diagram for 77215 minerals and whole rock (squares) and Mg-suite whole rocks (filled circles). Additional data (open circles) from Nakamura et al. [26]. Inset shows deviation in parts in 10 000 of the individual data from the best fit line to the data reported here and all but the two high-density separates from Nakamura et al. [26]. Only data for 77215 are used to determine the lines shown in the figure.

