
Figure 3. Modulation of the hematopoietic niche by neutrophil transfer.
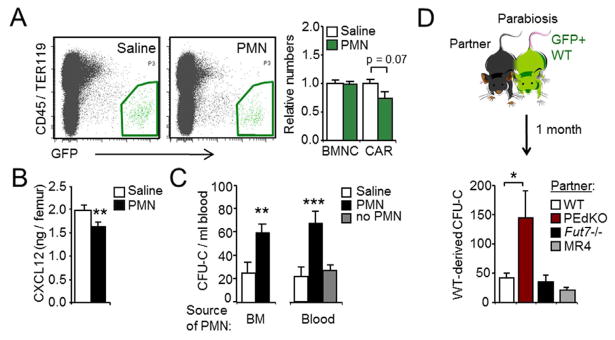
(A) Representative plots and relative number of BMNC and CAR cells (green regions) in the BM of Cxcl12-Gfp mice injected with saline or with neutrophils. BM samples were analyzed at ZT1. n=7–10 mice.
(B) CXCL12 protein levels in WT mice treated as in (A). n=10–14 mice.
(C) CFU-Cs in the blood of mice treated with BM- or blood-derived neutrophils, or blood leukocytes depleted of neutrophils (no PMN). Blood samples were analyzed at ZT1. Note that the baseline levels of CFU-C in blood differ with the neutrophil-depletion experiments (Figure 2D) because samples were collected at different times of the day, ZT5 and ZT1, respectively. n=6–14 mice.
(D) Scheme of parabiosis experiments, and number of blood CFU-C derived from GFP+ WT mice after one month. n=5–12 pairs.
Data are shown as mean ± s.e.m. *P<0.05, **P<0.01, ***P<0.001. See also Figure S3.