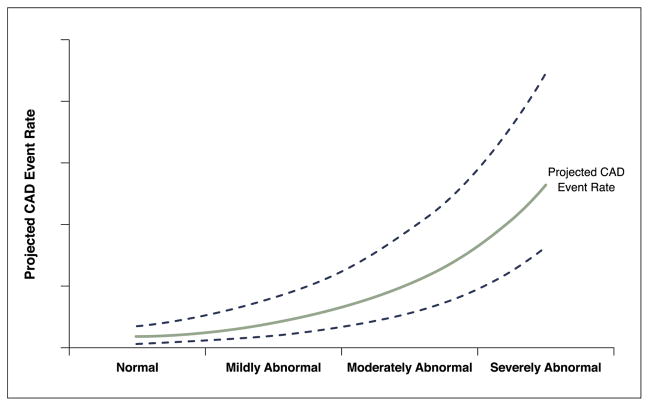
Figure 1. Projected CAD Event Rates.
A theoretical plot of the relationship between abnormal stress imaging findings and projected CAD events is shown. The lines include the average projected CAD event rate and 95% confidence intervals. As the stress imaging abnormalities become more extensive and severe, the projected CAD event rate increases. Conversely, for subsets with normal or mildly abnormal studies, the event rates are low. CAD = coronary artery disease.

