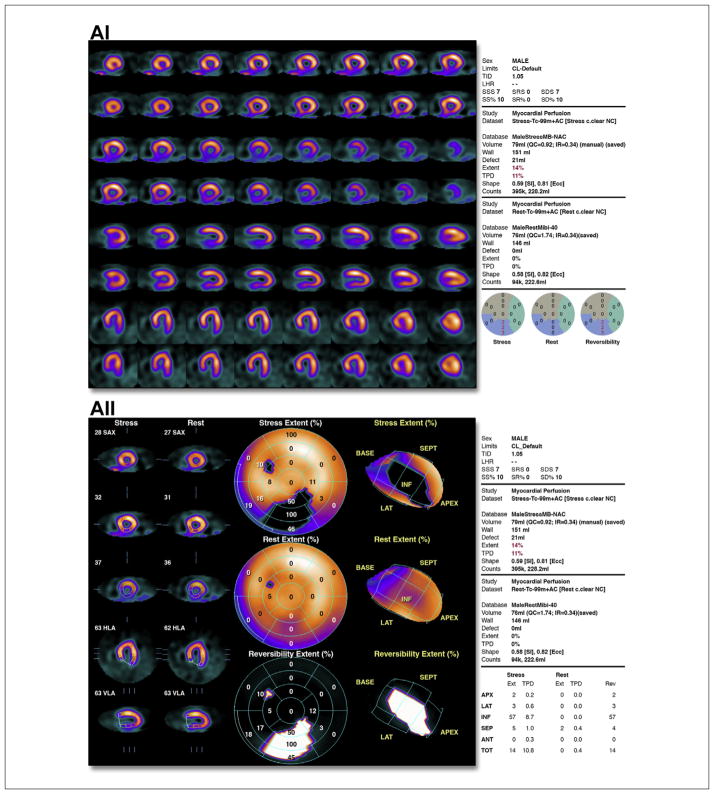
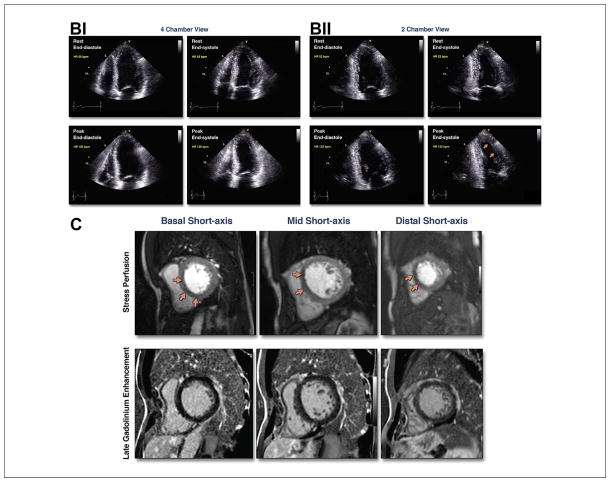
Figure 5. Case Examples.
(A) (i) Illustrative case of moderate ischemia with stress myocardial perfusion SPECT. Regadenoson stress (upper rows)/rest (lower rows) Tc-99m sestamibi SPECT images show moderate reduction of perfusion in the distal, mid, and basal inferior wall. Semiquantitative visual analysis (lower right polar maps) reveals 3 abnormal segments at stress with a total score of 7 and normal rest scores. The summed difference score is 7, representing 10% of the myocardium. (ii) Quantitative analysis of the case shown in i. Stress polar maps (middle column) reveal a perfusion defect (black area) on stress images (top) and normal rest images (middle). The TPD at stress is 11% and at rest is zero, indicating an ischemic TPD of 11%. (B) Illustrative case of moderate ischemia with stress echocardiography. Apical views from an exercise stress echocardiogram show moderate ischemia. Regional wall motion is normal at rest. At peak stress, wall motion abnormalities (severe hypokinesis) are observed in 3 segments: mid anterior, apical anterior, and apical lateral segments (arrows). See Online Videos 1, 2, 3, and 4. (C) Illustrative case of moderate ischemia with stress cardiac magnetic resonance perfusion imaging. The top row shows stress perfusion imaging, and the bottom row shows late gadolinium enhancement imaging of infarction. In both rows, basal short-axis locations are on the left, mid short-axis locations are in the middle, and distal short-axis locations are on the right. Note the spatial extent of the stress perfusion defect involving the basal anteroseptal (subendocardial) and inferoseptal (subendocardial and subepicardial), mid anteroseptal (subendocardial and subepicardial), and distal septal (subendocardial and subepicardial) walls. There are 7 subsegments of 32 demonstrated abnormal stress perfusion defects. None of these subsegments demonstrated evidence of infarction by late gadolinium enhancement imaging. This case illustrates a patient with moderate ischemia without infarction in the left anterior descending territory. SPECT = single-photon emission computed tomography; TPD = total perfusion deficit.


