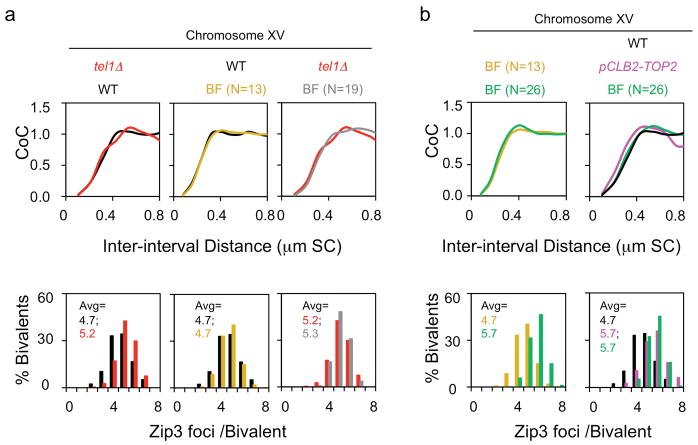
Extended Data Figure 7. Mutant CoC and CO number phenotypes cannot be explained by increased DSBs or by prolongation of the CO-designation stage.
Mutants in the described CO interference pathway all confer coordinate changes in CO interference, which is reduced, and the total number of COs, which is increased, by about 20% on Chromosome XV. There are the expected consequences of a single defect in CO interference, as illustrated by corresponding BF simulations which quantitatively explain these results by a change in a single parameter, the interference length (LBF) (text Fig. 2, 3). This interference defect could comprise a defect in generation and spreading of the inhibitory signal and/or of the ability of unreacted precursors to respond to that signal (text; Methods - “BF simulations”). An increase in the number of COs can also occur as the result of either (i) prolongation of the CO-designation period or (ii) an increase in the number of DSBs8. Neither of these effects can explain the mutant phenotypes described in the text.
(i) CO-designation precedes SC formation and thus the pachytene stage14. Time course analysis of representative mutant strains reveals that, in sir2 mutants and in top2SNM, meiosis proceeds through pachytene and the two meiotic divisions normally (Extended data Fig. 8a; ref. 14; data not shown). slx5/8 mutants and PCLB2-TOP2 mutants show no delay in progressing through prophase to pachytene (not shown) but show a delay in meiosis I (slx5) or pachytene arrest (PCLB2-TOP2) (Extended data Fig. 8a; not shown). The pCLB2-TOP2 top2YF mutant does show a delay in achieving pachytene, as well as pachytene arrest, but exhibits the same CO patterning phenotype as all other mutants, which show no pre-pachytene delay. Thus, prolonged CO-designation is not the basis for these phenotypes.
(ii) An increase in DSBs, without any change in CO interference, does increase the number of COs; but has very little effect on CO interference relationships (CoC curves) in budding yeast8. Correspondingly, two lines of evidence show that the mutant defects described here cannot be attributed to an increase in DSBs. a, A tel1Δ mutant exhibits increased DSBs but no change in CoC relationships. TEL1 encodes the yeast homolog of ATM. Absence of Tel1 confers a 50% increase in DSBs62 and a 10% increase in number of Zip3 foci (in ref. 8 Figure S7; reproduced in Extended Data Fig. 7a left, red color). However: (i) there is no change in CoC relationships relative to WT (Extended Data Fig. 7a left); (ii) the increase in COs is precisely that predicted on the basis of CO homeostasis (ref. 8; text Fig. 2d, filled black circle at 19 DSBs/precursors per Chr XV); and BF simulation accurately describes the tel1Δ phenotype, relative to WT, by a change in a single parameter: the level of DSBs (N=19, grey, vs 13, gold, in WT). The latter point is documented in Extended Data Fig. 7a middle and right. The middle panel shows the BF best-fit simulation for WT Chromosome XV, where N=13 (gold), compared to the experimental CoC curve (black; from text Fig. 1); the right panel shows the BF best-fit simulation for tel1Δ Chromosome XV, where N = 19 (grey) and all other parameters are the same as for WT, compared to the experimental CoC curve (red) from the left panel. b, BF simulations predict no/little change in CoC with increasing DSBs for yeast Chromosome XV (not shown). More specifically: in order to explain the increased number of COs observed in the analyzed mutants, e.g. pCLB2-TOP2, the value of N required for BF simulations of Chromosome XV would be 26 (double the WT value of N=13). If BF simulations are carried out under the same parameter values used for WT except that N=26 instead of N=13, the predicted CoC curve is unchanged as compared to that predicted for WT (left panel, compare gold for N=13 vs green for N=26). Correspondingly, the CoC curve predicted for N=26 (green) matches the WT CoC curve (black) and is unlike the CoC curve for the mutant (pink) (right panel).
Additional evidence that DSB number is not altered in pCLB2-TOP2 versus TOP2 is presented in Extended Data Fig. 4 and 8.

