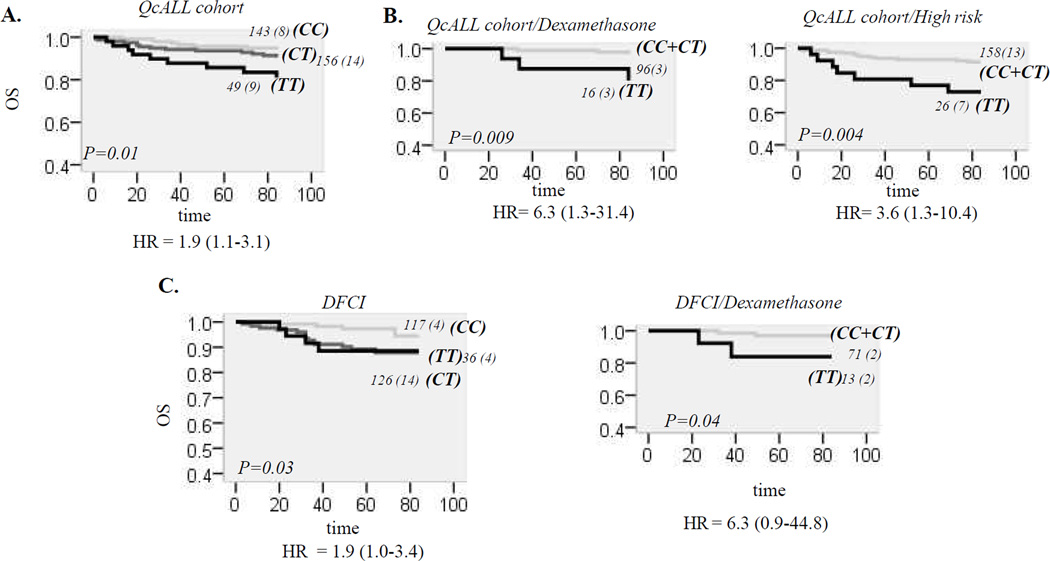
Figure 3. Relationship between Bim C29201T and OS in ALL patients.
A. OS according to C29201T genotypes in discovery group (QcALL). OS curves are given for CC, CT and TT genotype. The number of all patients in each curve (with the number of patients that died in brackets) is indicated next to the curve. OS difference between genotype groups is estimated by log-rank test and p value is given on the plot. Genotype-associated risk (univariable hazard ratio, HR, with 95% confidence interval (CI, in brackets) is indicated below plot).
B. OS curves according to Bim C29201T genotypes in high risk patients and patients treated with dexamethasone. OS for QcALL patients who received dexamethasone (left plot), or who were assigned to high risk (right plot), with (black line) and without (gray line) TT29201 genotype.
C. OS curves according to genotypes of Bim C29201T polymorphism in replication cohort. Left plot is OS for all patients of replication cohort (DFCI). Curves are represented for CC, CT and TT genotypes. Right plot is OS for patients with and without TT genotype who received dexamethasone.

