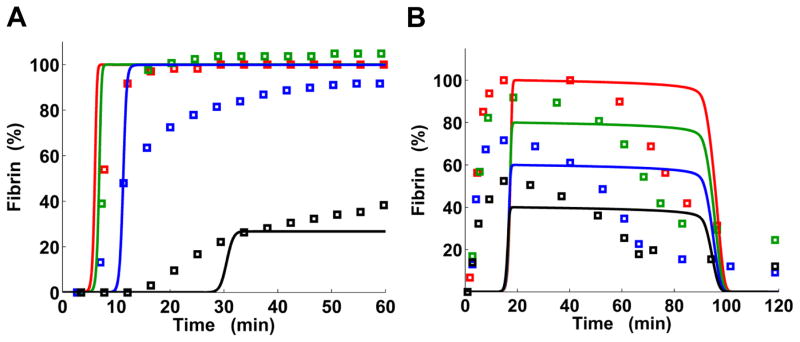
Fig. 2.

Kinetic model captures fibrin formation modulation by prothrombin and fibrinogen. Solid lines, model output; square markers, turbidimetric measurements. A: Prothrombin titration. The colors represent different levels of initial prothrombin: black, 1% of the normal average value (i.e., 1.40 μM); blue, 10%; green, 50%; and red, 100%. Experimental data were extracted from Fig. 2 of Ref. 12. To facilitate comparisons with model predictions, the absorbance baseline was set to 0 and the data were normalized to the maximum absorbance level achieved for 100% prothrombin. Model output was normalized to the maximum concentration achieved in the simulation for 100% prothrombin. While in the experiment the TF concentration was not determined, we used the default TF concentration in the simulation. B: Fibrinogen titration. The colors represent different levels of initial fibrinogen: black, 8.82 μM; blue, 13.24 μM; green, 17.65 μM; and red, 22.06 μM. Experimental data were extracted from Fig. 5D in Ref. 11. The absorbance baseline was set to 0 and the experimental data were normalized to the maximum absorbance level. The model output was normalized to the maximum fibrin concentration achieved for 22.06 μM fibrinogen. In the model, thrombin generation was initiated with 1 pM TF and fibrinolysis was activated by adding external tPA (at time 0) at a concentration of 3.50 nM; these values were chosen to match the experimental conditions.
