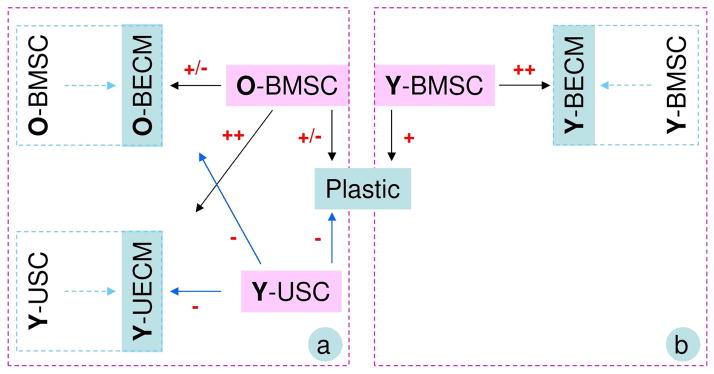
Fig. 6.

A flow chart of the comparison (a) between Young UECM (Y-UECM) and Old BECM (O-BECM) from this study and the comparison (b) between O-BECM and young BECM (Y-BECM) from a previous study [6]. Chondrogenic potential in either hBMSCs or hUSCs after expansion on Plastic, BECM, or UECM was graded as strongly positive (+++), very positive (++), positive (+), positive/negative (+/−), and negative (−).
