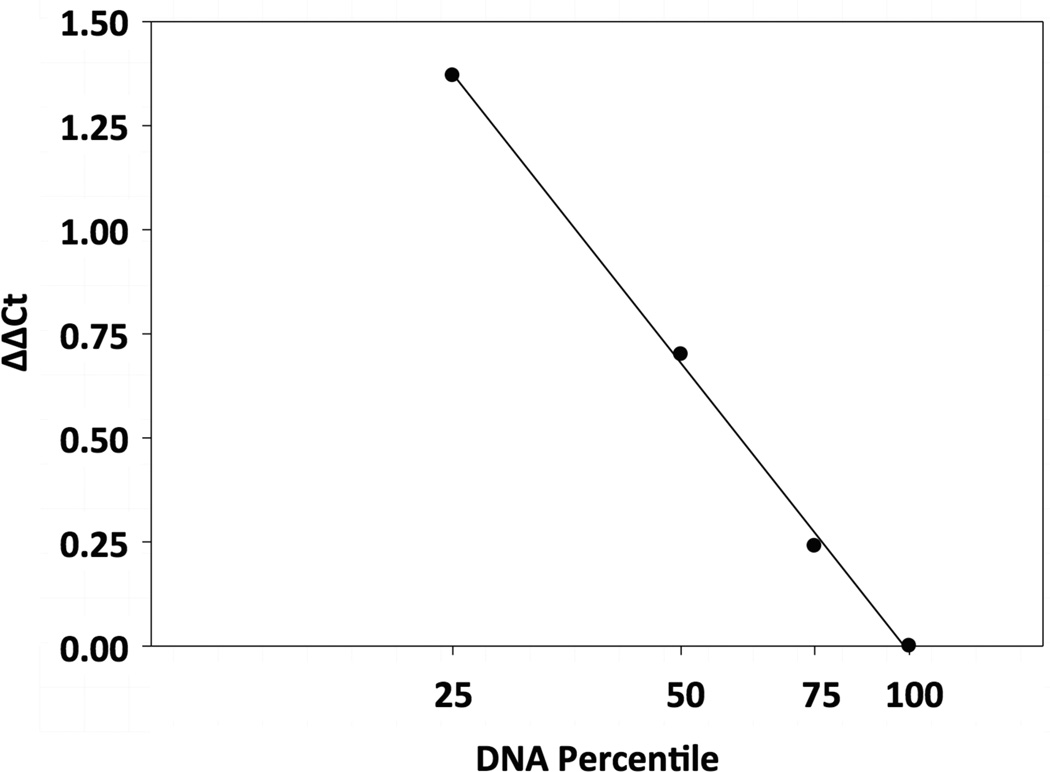
Figure 1. Standard Curve of the Real-Time PCR Deletion Assay.
Genomic DNA from hamster POT2 and H2T cells was mixed at ratios of 100:0, 75:25, 50:50, 25:75, and 0:100, respectively, and was analyzed by multiplex real-time PCR for both p16 and α-CMHC loci. The resulting cycle threshold (Ct) values were normalized against POT2 (p16+/+, dosage = 100%). The normalized Ct values, ΔΔCt, were plotted against the p16 dosage in the POT2/H2T DNA mixtures (in exponential form) to yield a standard curve. For each tumor sample, the p16 dosage was determined from the standard curve based on its normalized Ct values (Materials and Methods Section).

