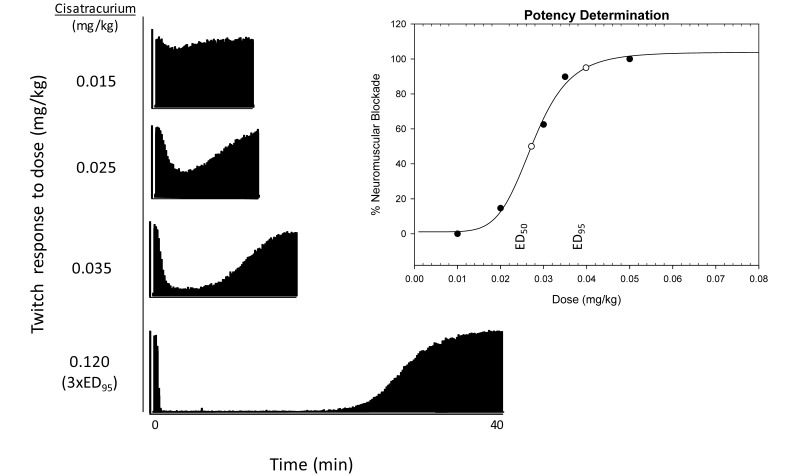
Figure 1.
Representative mechanomyographic tracings showing the cisatracurium dose–response data used to derive an ED95 of 0.037 ± 0.002 mg/kg. The bottom panel depicts the response to a 3×ED95 dose. Potency then was determined by using this dose–response model, from which 100% was estimated from twice the dose response and 0% is estimated from 1/5 of the dose response. The closed circles indicate the different doses administered to determine potency; open circles represent the doses estimated by the dose–response model; and ED50 and ED95 represent the effective doses of NMBD required to reduce twitch amplitude by 50% and 95%, respectively.

