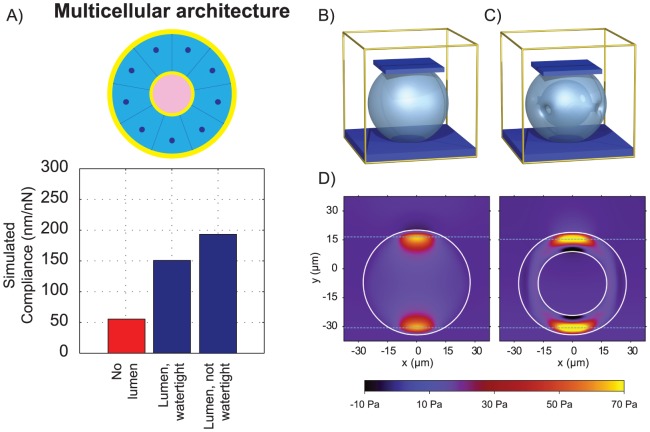
Figure 4. Mechanical differences are explained by the difference in multicellular architecture.
(A) Simulation of hollow and filled structures predicts decreased compliance (increased stiffness) of the structure associated with multicellular architecture. (B,C) Visualization of the 3D plate compression simulation environment using in this study to model the MCF10AT and MCF10A acini geometries. The yellow cube represents the simulation domain which is filled with incompressible fluid. The light blue object represents the deforming elastic–viscoelastic acinus, which is compressed between the dark blue plates. (D) Cross-section through 3D simulation of plate for hollow and filled structures. For numerical convenience, the influences of the plate and bottom surface are smoothed out across several layers of grid points, so they appear to overlap with the top and bottom of the acini. Regions of higher pressure are visible at the locations where the plate and bottom surface make contact. In the spherical shell simulation, a region of negative pressure is also visible, as the interior part of the shell is stretched during the deformation.

