
Figure 3.
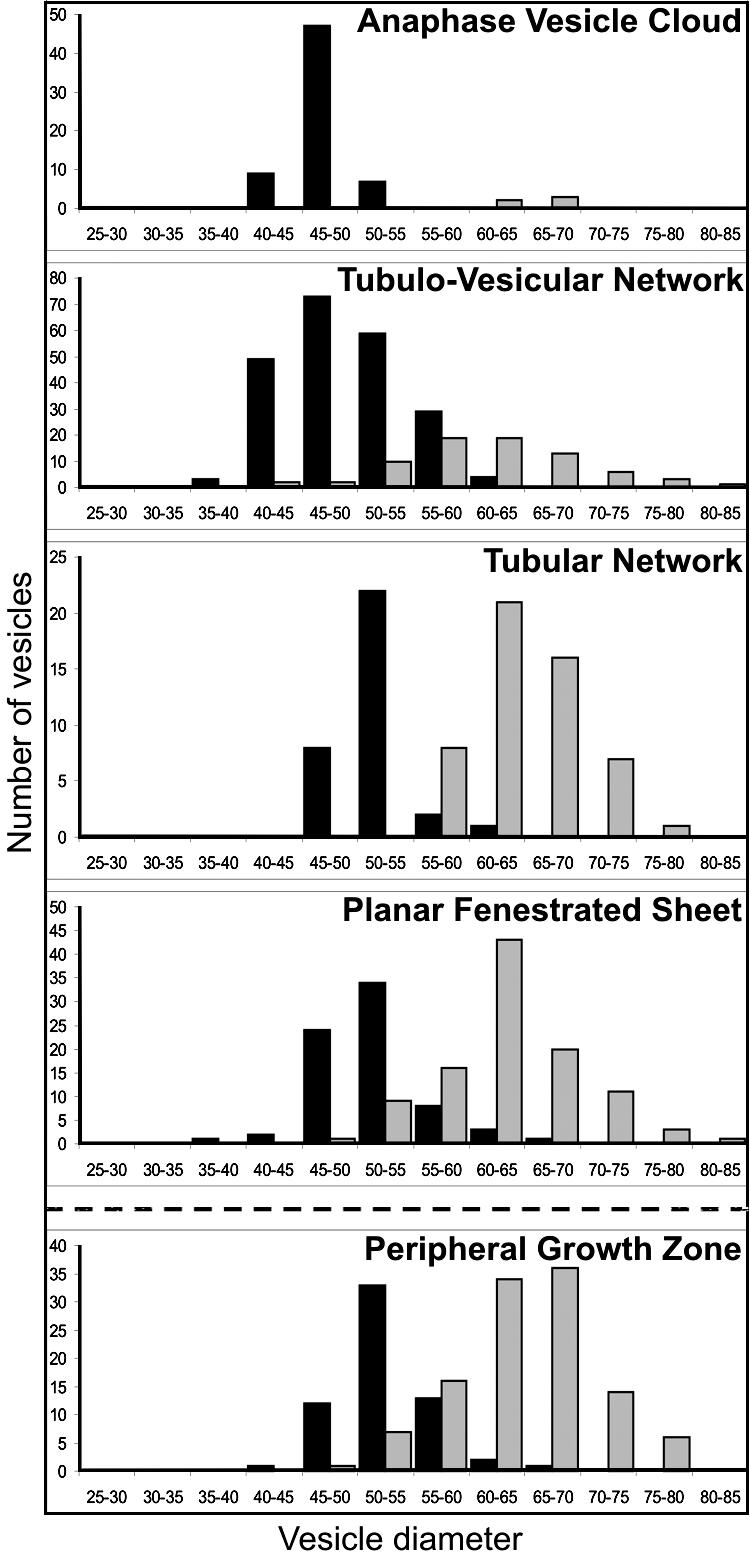
Vesicle Diameter Distribution during Cytokinetic Stages.
Histograms of the size distribution of cell plate–forming vesicles during different stages of cell plate formation. The individual bars indicate the number of vesicles per 5-nm diameter interval. Closed bars, small-dark vesicles; shaded bars, large-light vesicles.