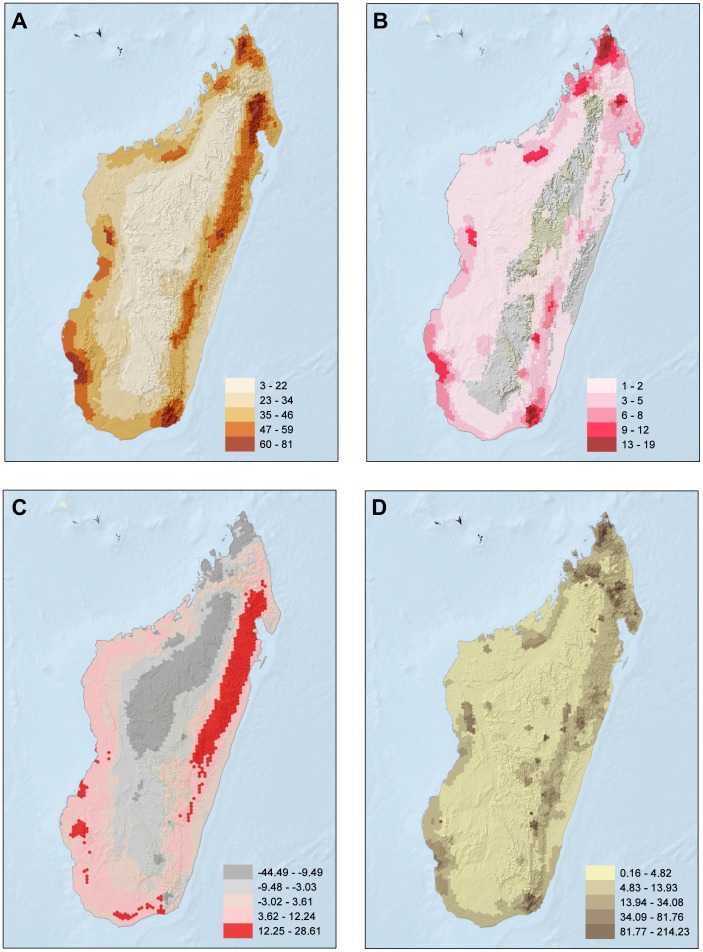
Figure 2. Spatial patterns for all reptile species included in this assessment.
A) species richness; B) richness of threatened species; C) residuals of the relationship between threatened species and total number of species (positive values were mapped in red, indicating cells that have more threatened species than expected for their richness alone, and equal or negative values in gray, indicating cells that have the same or fewer threatened species as/than expected for richness alone); D) richness of range-size rarity.

