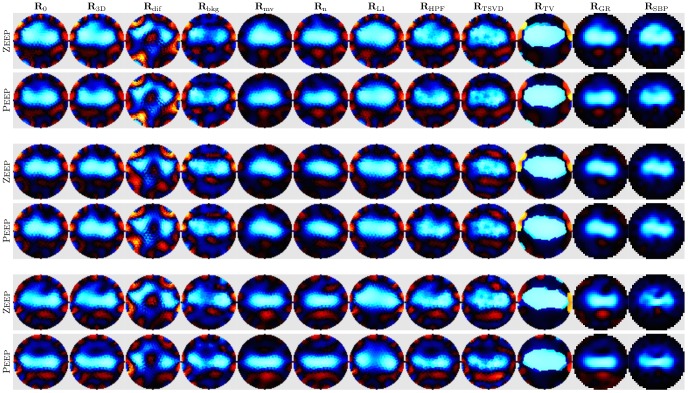
Figure 5. EIT images for all algorithms from three representative animals.
For each animal, images of VT at ZEEP and Peep are shown individually normalized to the maximum amplitude in each image (Blue: decrease in conductivity, Red: increase in conductivity). Each column shows images for a different algorithm. Peep, positive end-expiratory pressure; ZEEP, zero end-expiratory pressure; VT tidal volume.

