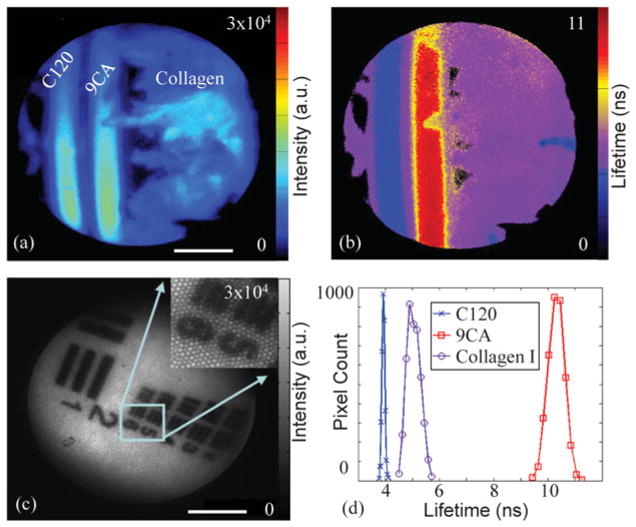
Figure 2.
Performance evaluation of fluorescence lifetime imaging microscopy system using fluorophores and biomolecules: (a) fluorescence intensity images and (b) average lifetime images of the coumarin 120 (C120), and 9-cyanoanthracene (9CA) dye solutions in capillaries placed on top of a dry collagen bed. Images acquired using the 460/50 nm filter. c: Image resolution was evaluated using a USAF test chart at a 0.2 ns gating time. Scale bar is 1 mm. d: Fluorescence lifetime histograms of the C120, 9CA, and collagen corresponding to images in (b).

