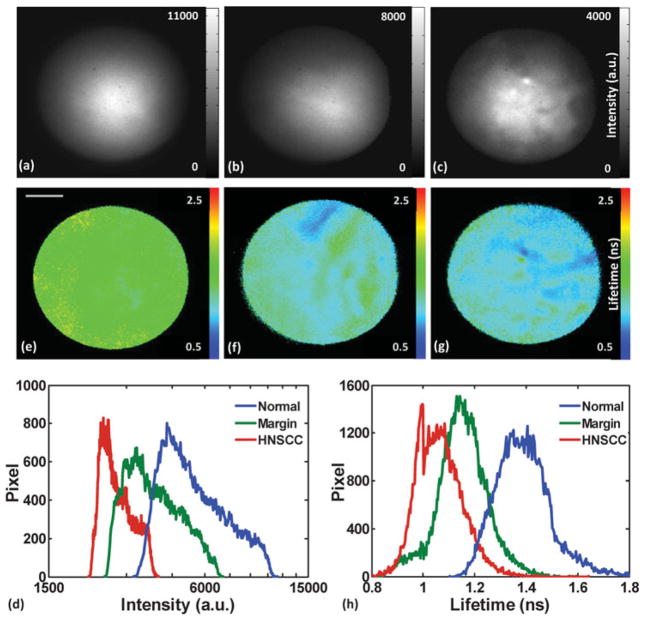
Figure 3.
Autofluorescence fluorescence lifetime imaging microscopy images of human buccal mucosa: (a)–(c) depict the intensity images, and (e)–(g) depict the average lifetime images from three areas: normal, tumor, and adjacent normal-tumor, their corresponding histograms are depicted in (d) for intensity and (h) for average lifetime. HNSCC, head and neck squamous cell carcinoma.

