Figure 6.
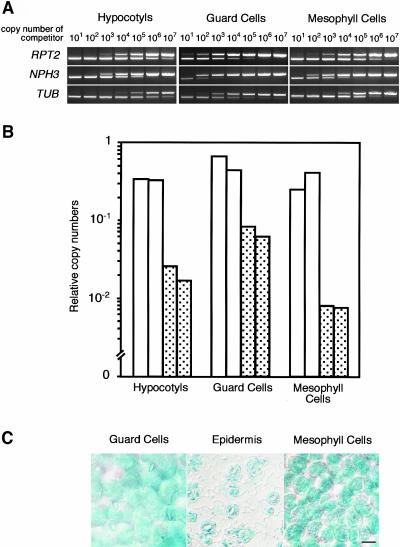
Expression Patterns of RPT2 and NPH3.
(A) RT-PCR with total RNA extracted from hypocotyls, highly purified guard cell protoplasts, and mesophyll cell protoplasts. The expression level of the tubulin gene (TUB) was used as an internal control.
(B) Copy numbers of RPT2 and NPH3 cDNAs in hypocotyls, guard cells, and mesophyll cells. Numbers were calculated against each competitor DNA and normalized to TUB. The graph shows relative copy numbers of RPT2 and NPH3 cDNAs (open and dotted bars, respectively) when the copy number of TUB was assigned a value of 1.0. The experiments were performed two times.
(C) The RPT2 promoter drives GUS activity (indicated by blue staining) in guard cells and mesophyll cells of wild-type plants expressing the RPT2-GUS fusion construct. To remove the mesophyll cell background, epidermal strips were peeled off the leaves. Bar = 20 μm.

