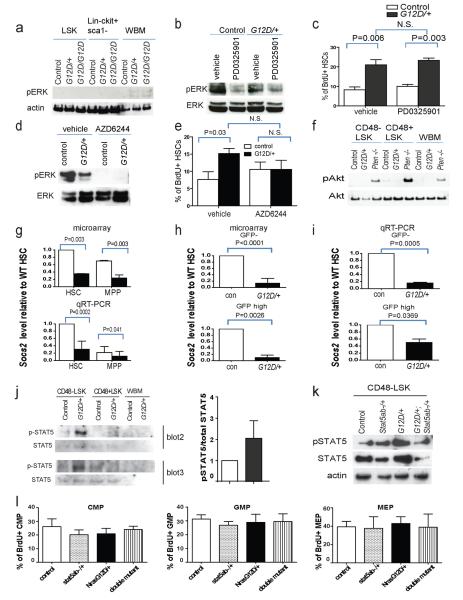
Extended data Figure 8. Nras activation increases STAT5 phosphorylation.
a) Western blot for phosphorylated ERK (pERK) in LSK stem/progenitor cells, Lin−c-kit+Sca1− progenitor cells, or whole bone marrow (WBM) cells from Mx1-cre; NrasG12D/+ (G12D/+) mice, Mx1-cre; NrasG12D/G12D (G12D/G12D) mice, or littermate controls 2 weeks after pIpC treatment b) Western blot of pERK and total ERK in 106 uncultured splenocytes from Mx1-cre; NrasG12D/+ (G12D/+) or control mice after 8 days treatment with PD0325901 MEK inhibitor or vehicle (blot is representative of four independent experiments). c) The frequency of BrdU+ CD150+CD48−LSK HSCs after a 24-hour pulse of BrdU to Mx1-cre; NrasG12D/+ (G12D/+) or control mice after 7 days of PD0325901 MEK inhibitor or vehicle (mean±s.d. from four experiments). d) Western blot of pERK and total ERK in 106 uncultured bone marrow cells from Mx1-cre; NrasG12D/+ (G12D/+) or control mice after 8 days of AZD6244 MEK inhibitor or vehicle (blot is representative of four independent experiments). e) The frequency of BrdU+ CD150+CD48−LSK HSCs after a 24-hour pulse of BrdU to Mx1-cre; NrasG12D/+ (G12D/+) or control mice after 7 days of AZD6244 MEK inhibitor or vehicle (mean±s.d. from four experiments). f) Western blot for phosphorylated Akt (pAkt) in CD48−LSK HSCs/MPPs, CD48+LSK progenitors, or WBM cells from Mx1-cre; NrasG12D/+ (G12D/+) mice, Mx1-cre; Ptenfl/fl (Pten−/−) mice, or littermate controls 2 weeks after pIpC treatment. g) Socs2 transcript levels in HSCs and MPPs from Mx1-cre; NrasG12D/+ (G12D/+) or control mice by microarray analysis (top, n=3) and qRT-PCR (bottom, n=7). h, i) Socs2 transcript levels in GFP− and GFPhigh HSCs from Mx1-cre; NrasG12D/+; Col1A1-H2B-GFP; Rosa26-M2-rtTA mice and littermate controls by microarray (h, n=3) and qRT-PCR (, n=3). j) Western blotting showed that pSTAT5 levels were significantly increased in CD48−LSK HSCs/MPPs from Mx1-cre; NrasG12D/+ mice as compared to control mice. Left panel shows western blots of pSTAT5 and total STAT5 from two independent experiments. Right panel shows quantification of pSTAT5 levels from western blots from three independent experiments (signals were quantitated using NIH ImageJ software). Blot 1 was shown in Figure 4e. k) Western blot showed that STAT5 levels were reduced in CD48−LSK HSCs/MPPs from Mx1-cre; Stat5ab−/+ or Mx1-cre; NrasG12D/+; Stat5ab−/+ mice as compared to control and Mx1-cre; NrasG12D/+ mice (blot is representative of four independent experiments). l) BrdU incorporation into common myeloid progenitors (CMPs; Lin−Sca1−ckit+CD34+CD16/32−), granulocyte macrophage progenitors (GMPs; Lin−Sca1−ckit+CD34+CD16/32+), and megakaryocyte erythroid progenitors (MEPs; Lin−Sca1−ckit+CD34−CD16/32−) from control, Mx1-cre; Stat5ab−/+, Mx1-cre; NrasG12D/+, or Mx1-cre; NrasG12D/+; Stat5ab−/+ mice after a 2.5 hour pulse of BrdU (n=4 mice/treatment). Data represent mean±s.d.. Two-tailed student's t-tests were used to assess statistical significance.

