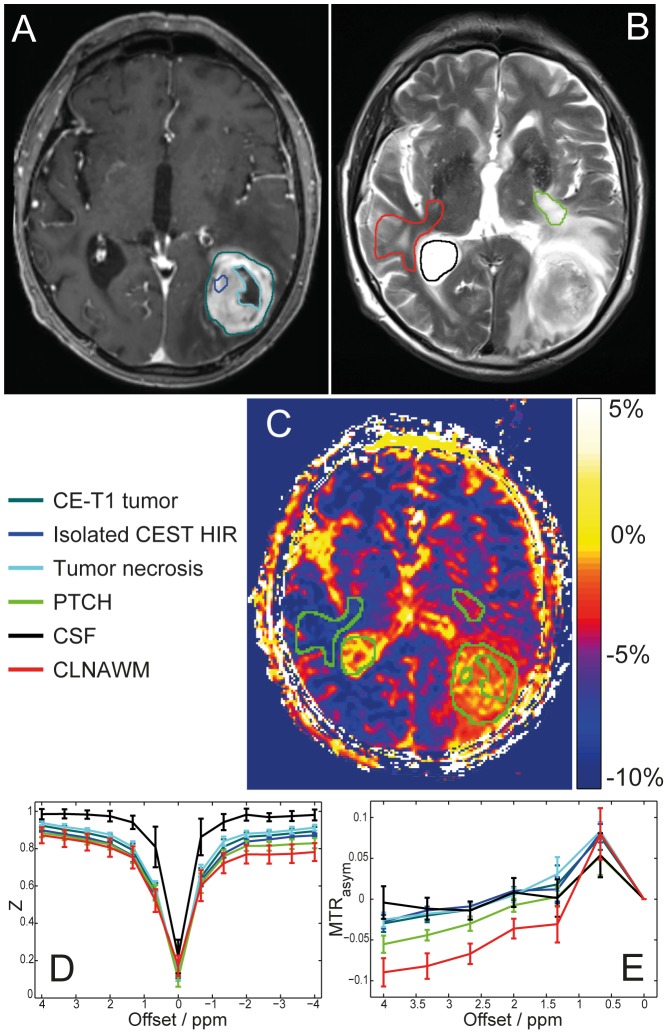
Figure 3. Regions of interest (ROI) selection for spectral analysis and MTRasym quantification.
Left occipital glioblastoma of a 79 year old patient, CE-T1 (A) and T2-weighted images (B) with color coded ROIs: CE-T1 tumor, isolated CEST HIR within CE-T1 margins, tumor necrosis, PTCH within T2 edema margins, CSF and CLNAWM. CEST contrast based on MTRasym (C): Same ROIs illustrated in green for improved visualization. Z-spectrum (D) and asymmetry analysis (E) shown. Analyses of Z-spectra reveals that a decrease of NOE upfield effects at −3.3 ppm causes the hyperintense MTRasym contrast in the tumor regions, while no clear APT peak around +3.3 ppm could be identified in any of the analyzed tissues. Even though MTRasym shows high intensities both in CSF and isolated CEST HIR within CE-T1 tumor, Z-spectrum analysis reveals that the underlying asymmetry has a different origin: no saturation transfer is apparent in CSF at ±3.3 ppm (D black line) while in tumor regions (D dark green, dark blue and light blue lines) MTRasym = 0 reflects that NOE signals (−3.3 ppm) and saturation transfer effects at the opposite side of the Z-spectrum (+3.3 ppm) are of equal size. Furthermore the width of the Z-spectrum of CSF is decreased due to the longer T2 relaxation time.

