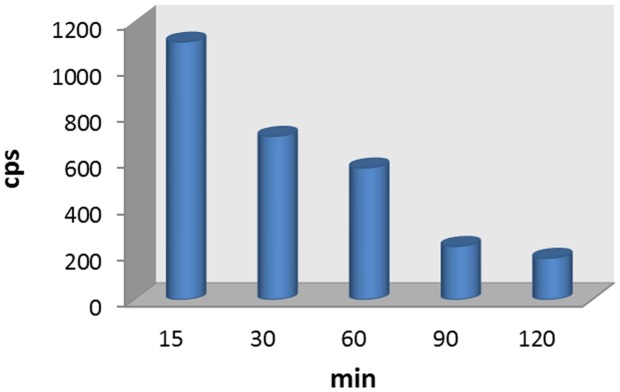
Figure 8. Bar diagram for the radiometabolite analysis of the radiotracer using semipreparative RP-HPLC.

The blood samples were taken at various time points after [18F]FBuEA-GS 3 was injected intravenously.

The blood samples were taken at various time points after [18F]FBuEA-GS 3 was injected intravenously.