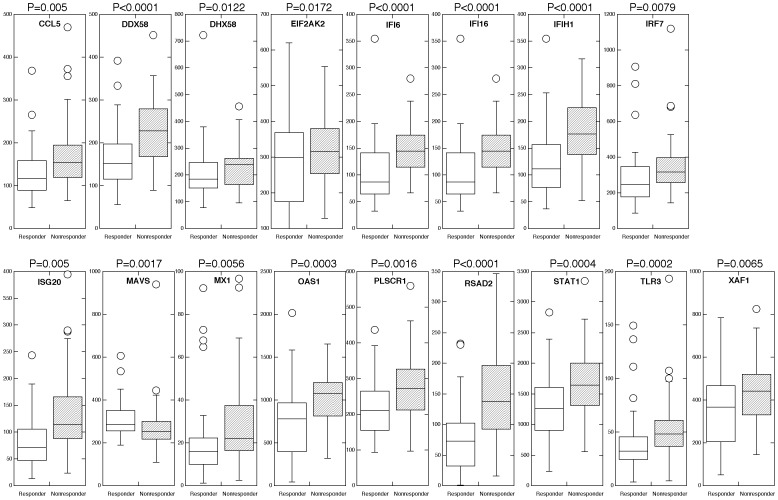
Figure 1. Differential expression of an IFN-regulated signature geneset in responders versus nonresponders to therapy.
Expression of an IFN-regulated signature geneset was determined in RNA extracted from FFPE liver biopsies by nCounter analysis. Boxplots of genes found to be statistically differentially expressed by nonparametric Mann-Whitney analysis (p<0.05).

