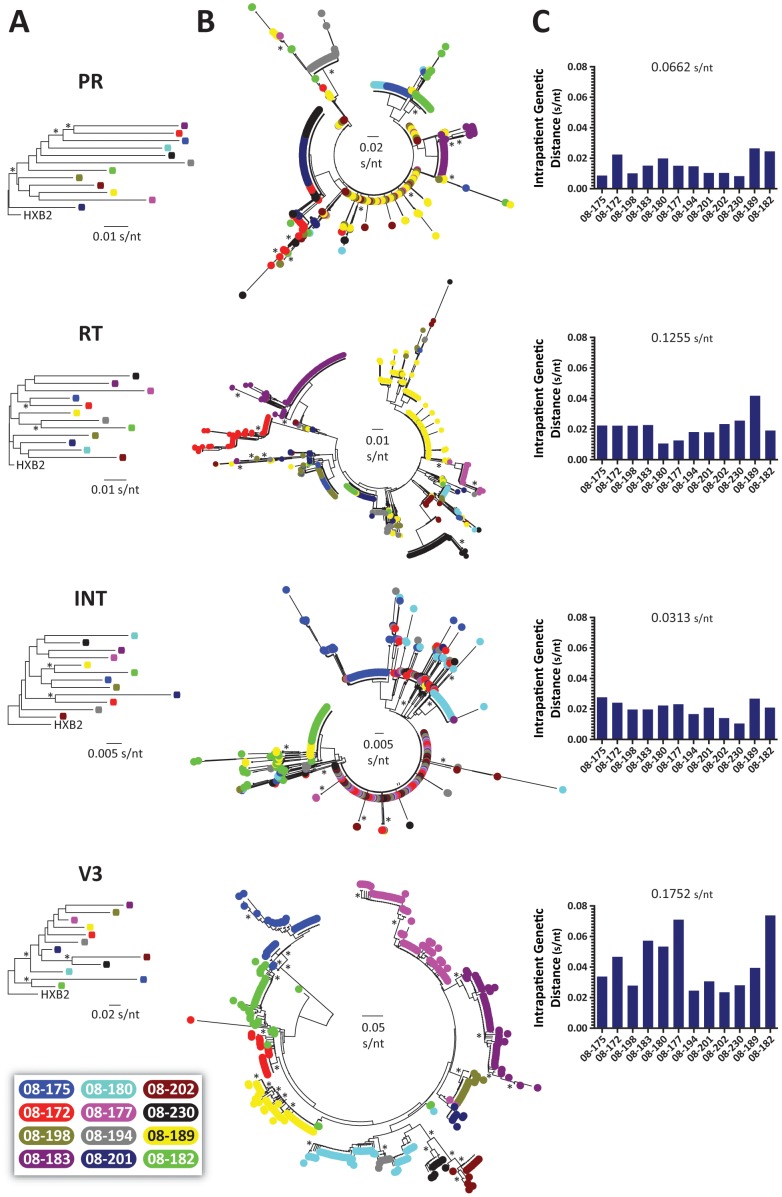
Figure 3. Phylogenetic and HIV-1 genetic diversity analysis.
(A) Neighbor-joining phylogenetic trees constructed using population (Sanger) sequencing of 105-bp fragments corresponding to the HIV-1 protease, RT, integrase, and V3 regions from the 12 patients. Phylogenetic trees were rooted using the HIV-1HXB2 sequence (GenBank accession number AF033819). (B) Neighbor-joining phylogenetic trees constructed using reads with a frequency >1 corresponding to 105-bp fragments from the protease, RT, integrase, and V3 regions. Each color-coded dot represents a unique variant, frequency is not depicted. Bootstrap resampling (1,000 data sets) of the multiple alignments tested the statistical robustness of the trees, with percentage values above 75% indicated by an asterisk. s/nt, substitutions per nucleotide. (C) HIV-1 intra- and inter-patient genetic diversities were determined using MEGA 5.05 [59].

