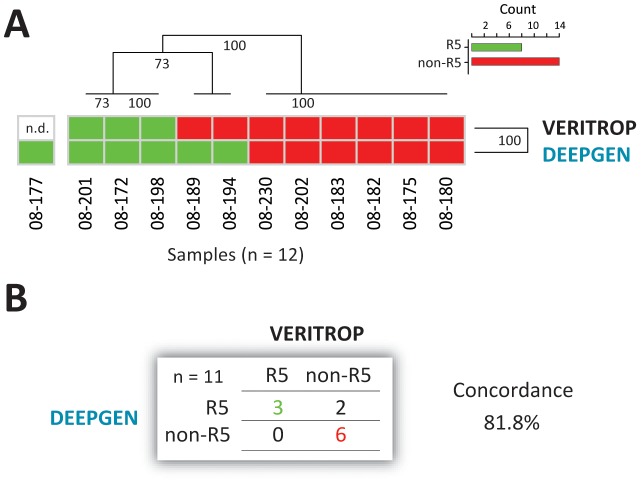
Figure 6. HIV-1 coreceptor tropism determination using deep sequencing (DEEPGEN [43]) and a phenotypic assay (VERITROP [54]).
(A) Hierarchical clustering analysis was used to group the two HIV-1 coreceptor tropism determinations by similarity. Dendograms were calculated using the Euclidean distance and Complete cluster methods with 100 bootstrap iterations as described (http://www.hiv.lanl.gov/content/sequence/HEATMAP/heatmap.html). Bootstrap values are indicated. Green and red blocks indicate the absence or presence of non-R5 (X4) viruses, respectively, as determined by each assay. (B) Concordance between DEEPGEN and VERITROP.

