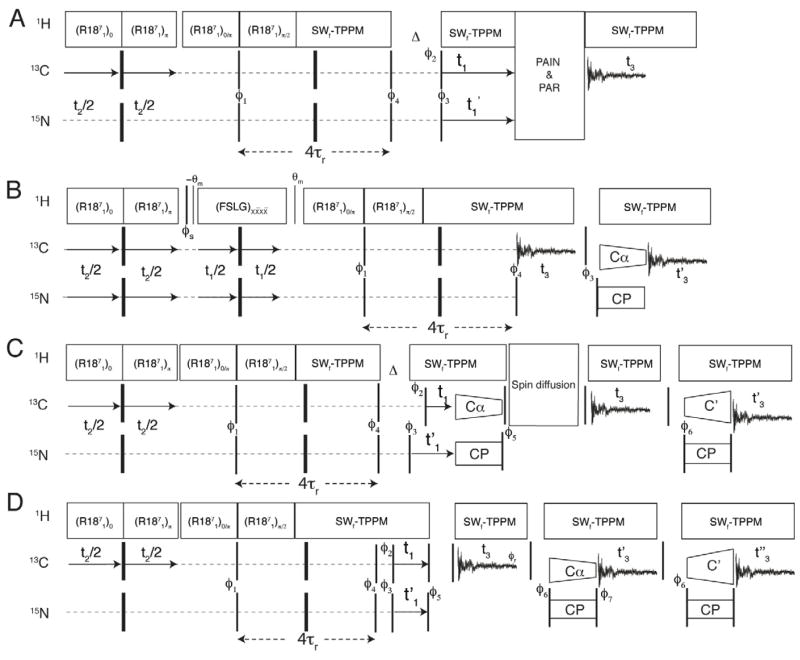
Figure 1.
Diagrams of MACSY pulse sequences that integrate separated local field spectroscopy and chemical shift correlation. A. Single acquisition, dual observation (SADO). B. Dual acquisition, dual observation (DADO). C. Dual acquisition, multiple observation (DAMO). D. Triple acquisition, multiple observation (TAMO). Thin and thick vertical lines represent 90° and 180° pulses, respectively. The thinner lines in Panel B represents small flip angle (35°) pulses. The phase cycles are as follows; ϕ1= 1, ϕ2= 1133, ϕ3= 11113333, ϕ4= 0022, ϕ5=3311, ϕ6= 1133. ϕ(N)(DCP)= 0022, ϕ(C)(DCP)= 00002222, ϕ(rec)= 02202002

