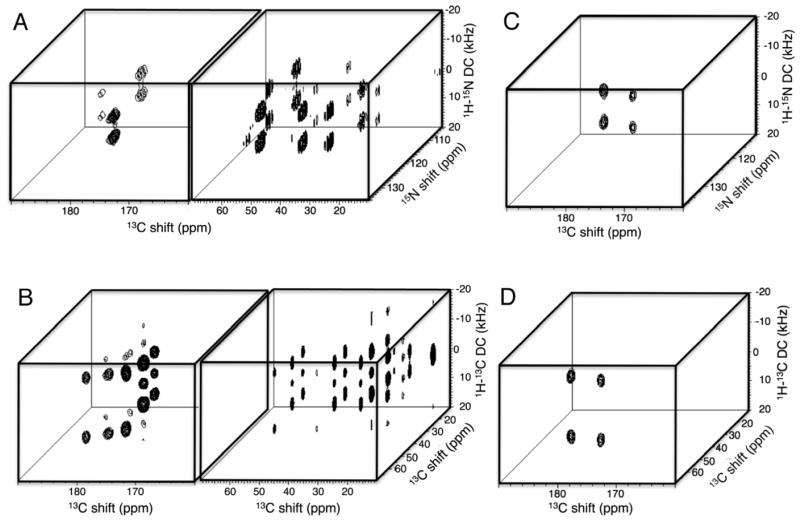
Figure 2.
Four different three-dimensional spectra obtained from a single DAMO experiment at 700 MHz. The three-dimensional spectra are from a uniformly 13C, 15N labeled sample of polycrystalline methionine-leucine-phenylalanine (MLF) obtained using the pulse sequence diagrammed in Figure 1C. A. 1H-15N/N(CA)CX spectrum with 13C chemical shift, 15N chemical shift, and 1H-15N heteronuclear dipolar coupling frequency dimensions. B.1H-13C/CXCY spectrum with 13C chemical shift, 13C chemical shift, and 1H-13C dipolar coupling frequency axes. C. 1H-15N/NCO spectrum with 13C chemical shift, 15N chemical shift, and 1H-15N dipolar coupling axes. D. 1HA-13CA/CA(N)CO spectrum with 13C chemical shift, 13C chemical shift, and 1H-13C dipolar coupling frequency axes.

