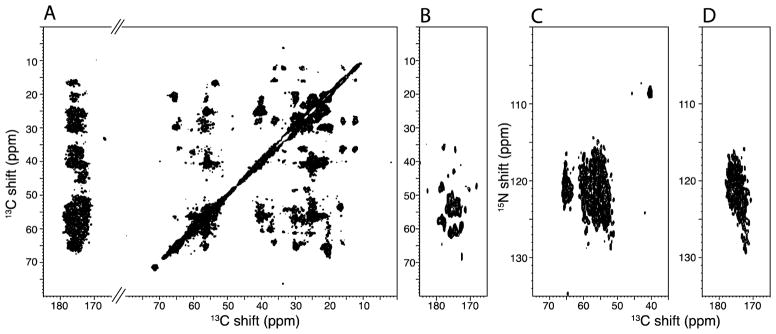
Figure 5.

Two-dimensional correlation spectra obtained from a uniformly 13C,15N labeled sample of the 350-residue membrane protein CXCR1 in phospholipid bilayers at 750 MHz. It was obtained with 50% data point coverage NUS using the pulse sequence diagramed in Figure 1D without the dipolar frequency evolution in the third dimension. A. and B. Sections of the same 13C/13C homonuclear correlation spectrum with 13C chemical shift frequency axes. C. and D. Section of 15N/13C heteronuclear correlation spectra with 13C chemical shift and 15N chemical shift axes.
