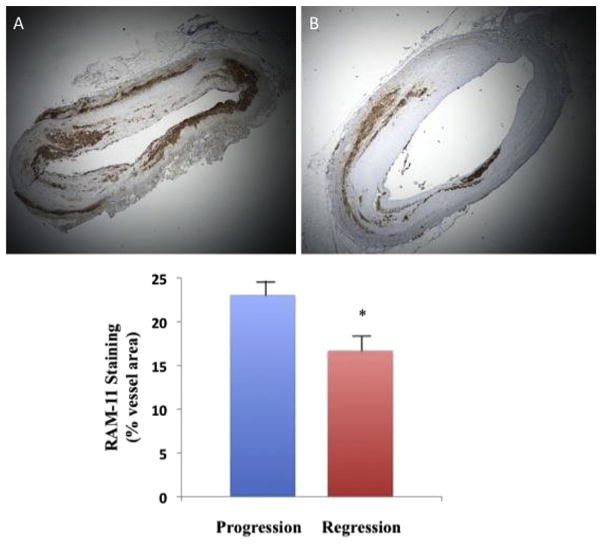
Fig. 3.
RAM 11 staining on histology slices showing a massive inflltration of macrophages in progression group (A, ×2 magnification) and a lower inflltration in regression group (B, ×2 magnification). Graph comparing the percentage of wall area occupied by RAM 11 staining show a significant difference in the two groups.

