Figure 2.

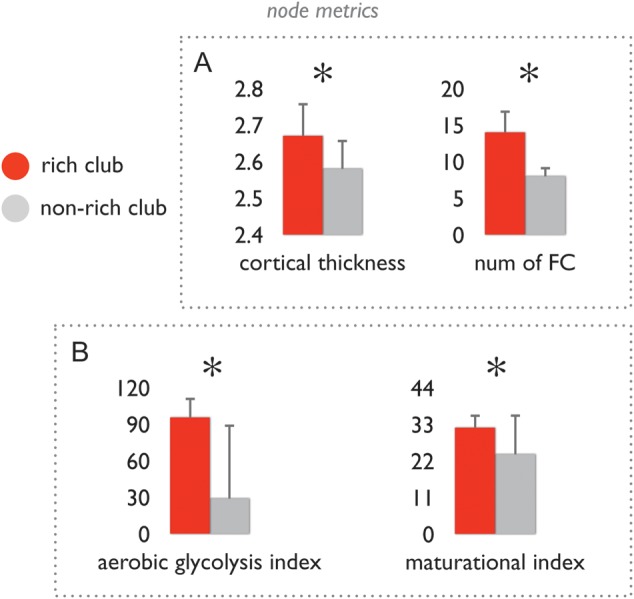
Structural and functional aspects of rich club and non-rich club nodes. (A) Left bar graph shows the class-average levels of cortical thickness (corrected for differences in regional volume). Right bar graph shows the number of positive (Tfc > 0) functional connections of rich club and non-rich club nodes, showing that the number of functional connections of rich club nodes was significantly higher than that of non-rich club nodes. Error bars express variation of node class values over the group of subjects. (B) Bar graphs show the mean values of the class of rich club nodes and non-rich club nodes of the aerobic glycolysis index as taken from (Vaishnavi et al. 2011) and the maturational index as taken from (Glasser and Van Essen 2011). Data shows that rich club nodes display a significantly higher metabolic energy use as compared to non-rich club nodes, and a significantly longer maturational trajectory than non-rich club nodes. *P < 0.05 (permutation testing, 10 000 permutations). Error bars express variation of values over the group of included regions.
