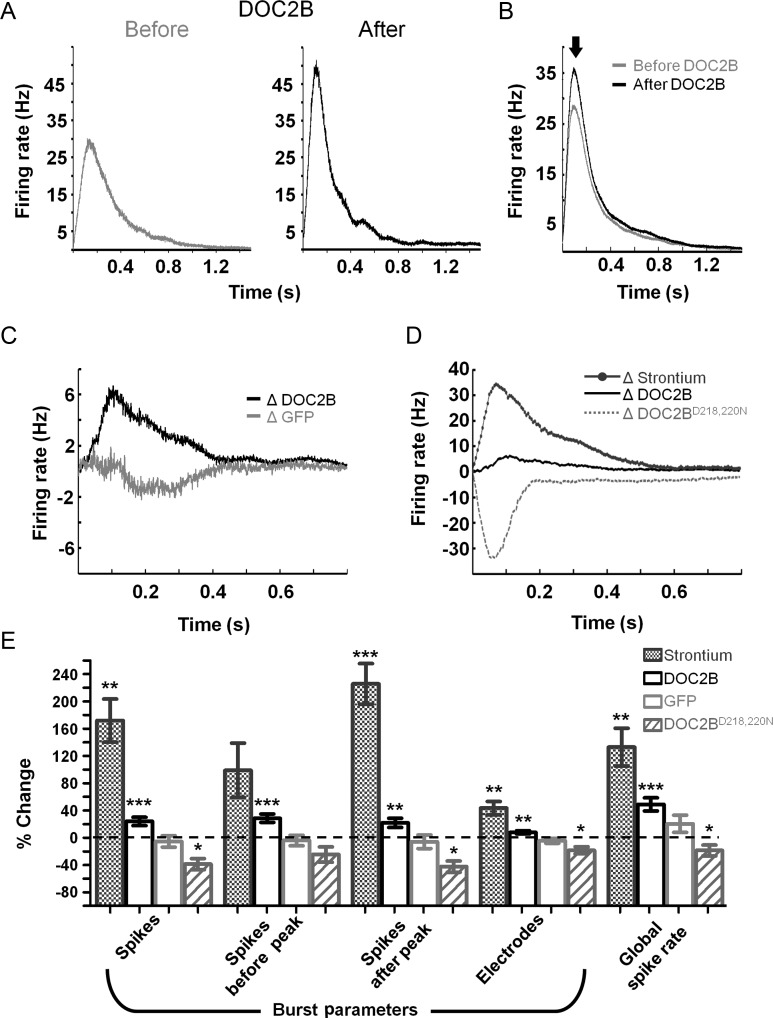
Figure 3.
Sustained DOC2B effect throughout the network burst. (A) A sample network-burst profile before (gray) and after (black) DOC2B overexpression shows the average firing rate throughout the network burst. DOC2B overexpression increases the average firing rate, specifically around the burst peak. (B) Average network-burst profiles from all DOC2B recordings before and after overexpression of DOC2B (gray and black traces, respectively; n = 15 DOC2B networks) show an increase in firing rate throughout the network burst. (C) To isolate the contribution of DOC2B to network activity for each experiment, the activity profile before DOC2B was subtracted from the activity profile after DOC2B and ΔDOC2B profile was generated (black trace) and averaged for all DOC2B experiments. The same procedure was applied to generate the ΔGFP profile (light-gray trace). As indicated by the black trace, following DOC2B overexpression, the average firing rate is higher throughout the burst while the ΔGFP profile displayed little change. (D) Average Δ network-burst profiles for Strontium application (dark-gray top trace; n = 6 Sr2+ networks) and DOC2BD218,220N overexpression (light-gray bottom trace; n = 9 DOC2BD218,220N network). Strontium application increases network-burst firing rate while DOC2BD218,220N overexpression decreases network-burst firing rate. (E) Average change in global and burst parameters supports the profiles analysis in D and shows a significant increase in number of spikes and the number of neurons participating in network bursts for DOC2B overexpression and Strontium application and a significant decrease in the same parameters for DOC2BD218,220N overexpression (comparison of each recording to itself prior to manipulation; 15 DOC2B recordings, 9 GFP recordings; 6 Strontium recordings, 9 DOC2BD218,220N recordings; *P < 0.05, **P < 0.01, ***P < 0.001, Student's t-test).

