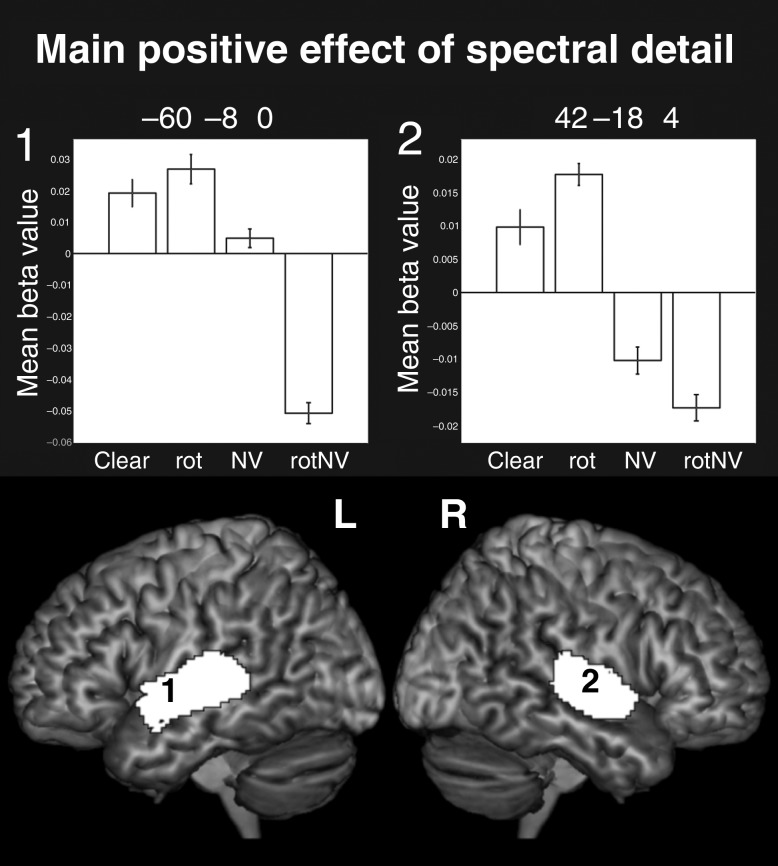
Figure 1.
Surface renderings of the main positive effect of spectral detail, peak level uncorrected P < 0.001, FDR cluster corrected at q < 0.05. Plots show the mean beta value with error bars representing the standard error of the mean corrected for repeated-measures comparisons. Note that since there was no implicit baseline, the plots are mean centered to the overall level of activation to all conditions.

