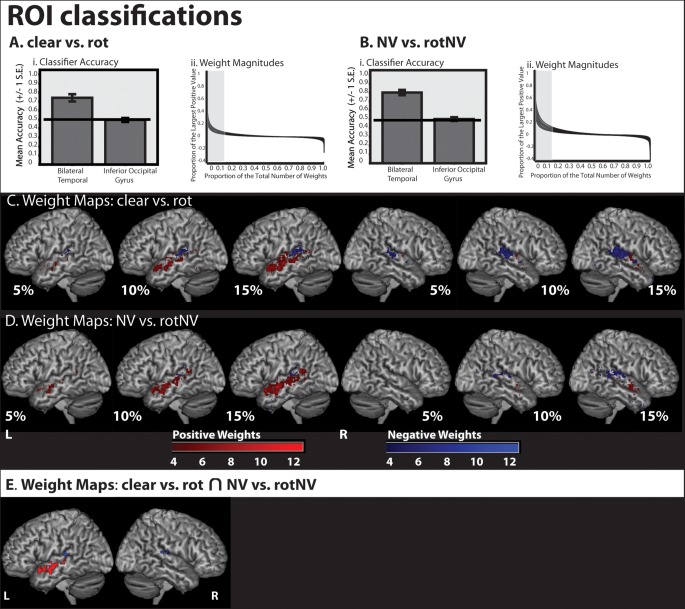
Figure 6.
Classifier accuracy and weight maps from classifications using the entirety of the bilateral temporal cortex (including PAC) and the inferior occipital gyrus (used as a control region). (Ai) Classifier accuracy (proportion correct) for (clear vs. rot). (Aii) Weight magnitude values of weights from (clear vs. rot). (Bi) Classifier accuracy (proportion correct) for (NV vs. rotNV). (Bii) Weight magnitude values of weights from (NV vs. rotNV). (C) The most discriminative 5%, 10%, and 15% of classifier weights from a classifier trained to discriminate (clear vs. rot). Color gradient indicates the degree of concordance across subjects. (D) The most discriminative 5%, 10%, and 15% of classifier weights from a classifier trained to discriminate (NV vs. rotNV). Color gradient indicates the degree of concordance across subjects. (E) Weights featuring in the top 15% of weight values common to both (clear vs. rot) and (NV vs. rotNV) and more than 4 subjects.

