
Figure 3.
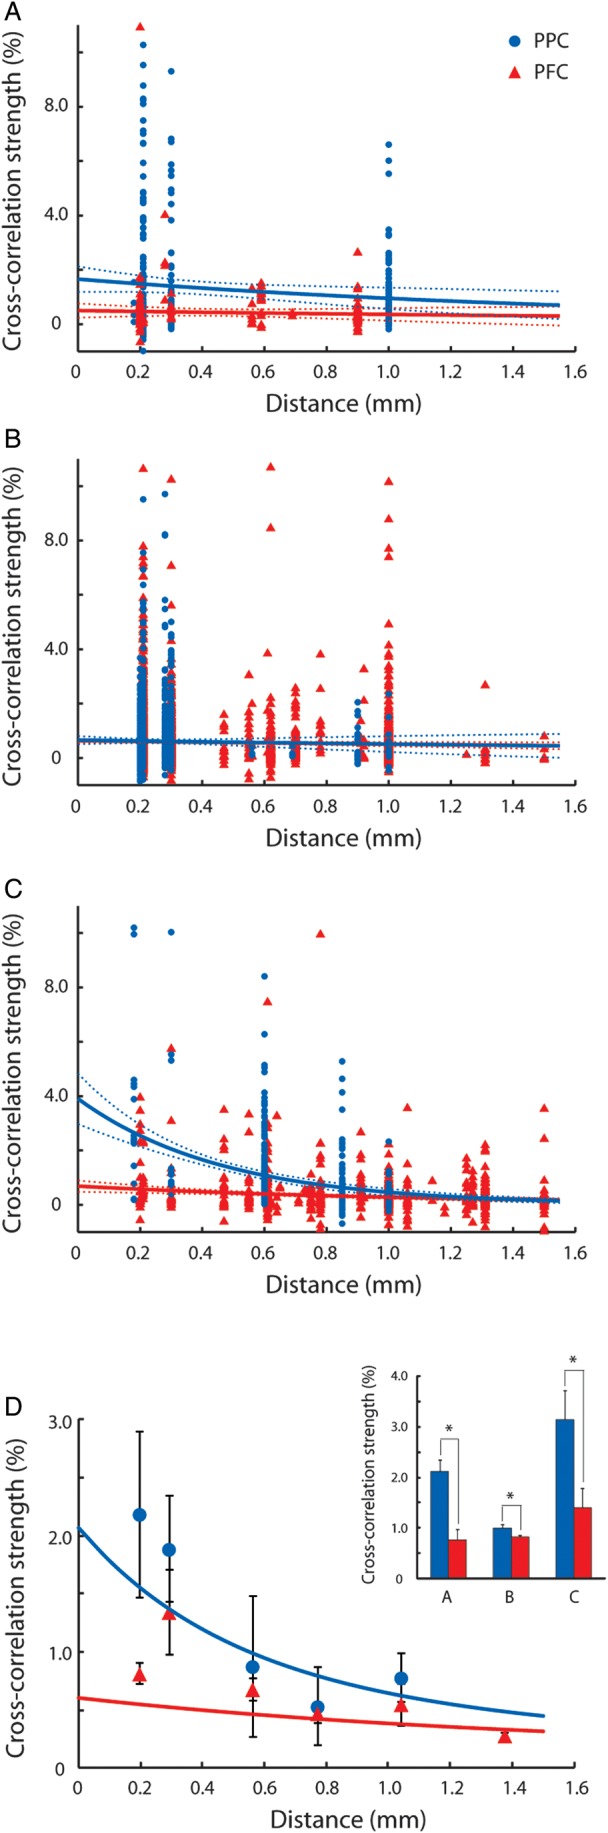
Effective connectivity as a function of distance. (A–C) Cross-correlation strength of prefrontal and parietal cortex as a function of electrode separation plotted for each of 3 animals. Each dot represents data from a pair of neurons. Blue and red dots and lines represent the parietal cortex and the prefrontal cortex, respectively. Dotted lines represent 95% confidence intervals. Up to 10 outliers appear outside the minimum or maximum bounds of the axes in each panel. (D) Cross-correlation strength averaged across monkeys. Data were first binned separately for each monkey, then averaged together at each distance, weighing equally each monkey. Error bars at each point represent standard error of the mean across monkeys. Blue and red curves represent average of curves in panels A–C. Inset illustrates average cross-correlation strength computed for neuron pairs with distances of ≤0.3 mm for each monkey. The center 5 ms of CCH peak was used. Blue and red bars represent the parietal and prefrontal cortex, respectively. Stars indicate statistically significant differences at the 0.05 significance level (t-test).