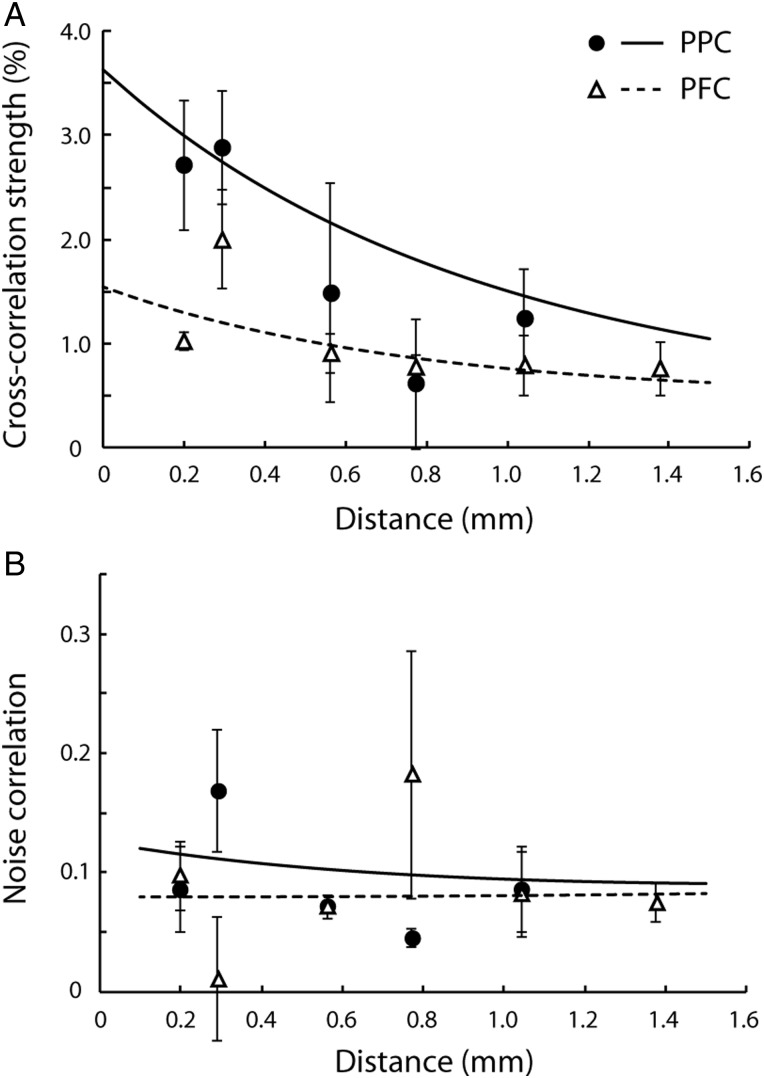
Figure 6.
Effective connectivity computed in different time scales. Mean cross-correlation strength and noise correlation averaged across monkeys. Circles/solid lines and triangles/dotted lines represent the parietal cortex and prefrontal cortex, respectively. Curves were fit based on all raw data points and superimposed on the average data points. Error bars represent standard error of the mean across monkeys. (A) Predictor-corrected average cross-correlation strength as a function of electrode separation. The center 20 ms of CCH peak was used. (B) Average noise correlation in the fixation period is plotted as a function of electrode separation.

