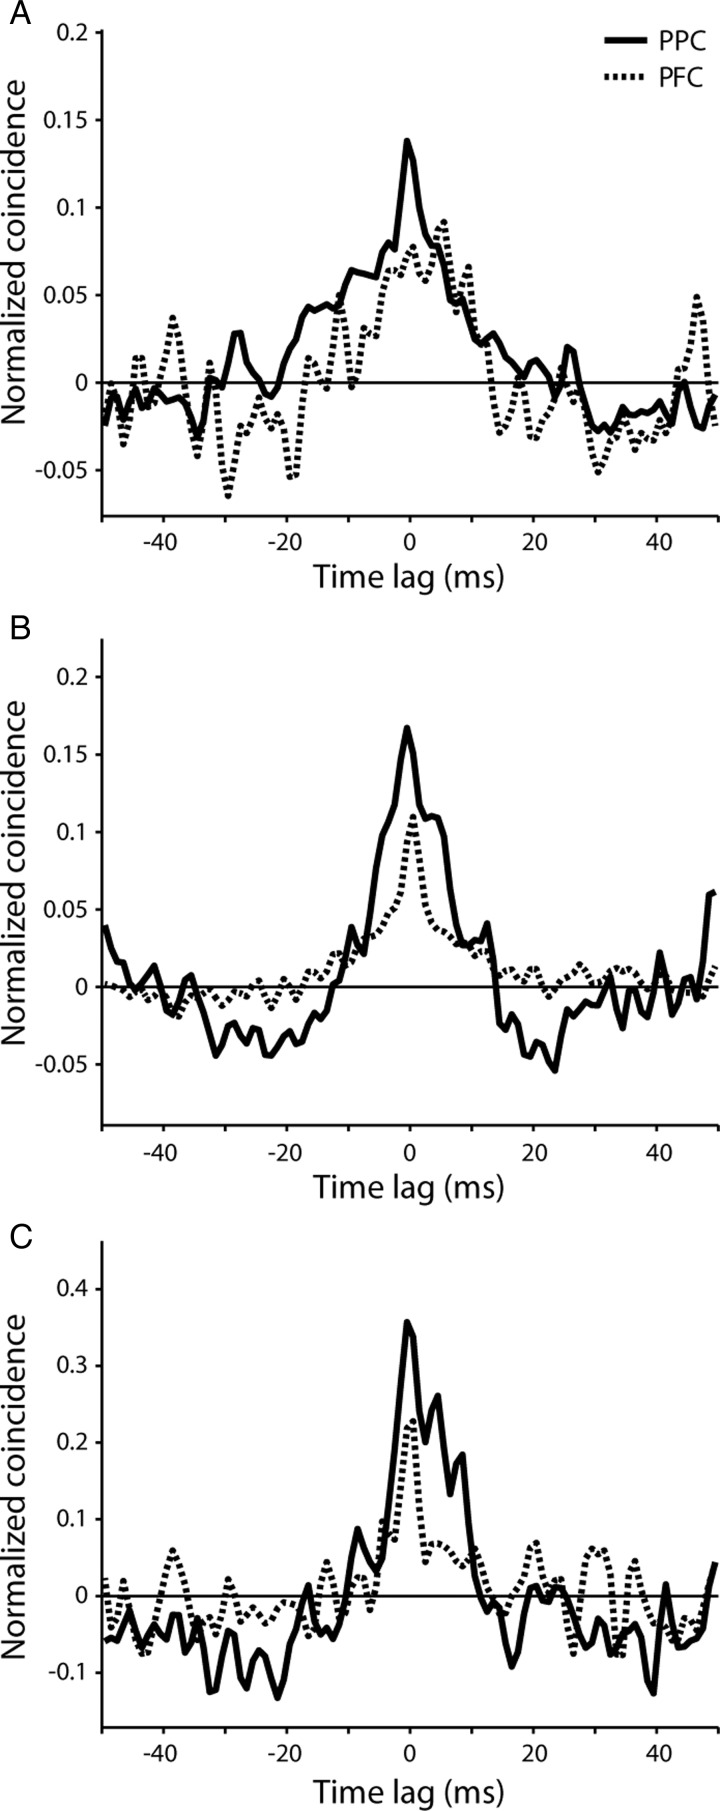
Figure 7.
Average cross-correlation in each monkey. (A–C) Average cross-correlation histogram for the prefrontal and posterior parietal cortex from pairs of neurons recorded within 0.3 mm from each other, shown separately for each monkey in each panel. Histograms have been smoothed with a 3-point triangular filter.

