
Figure 2.
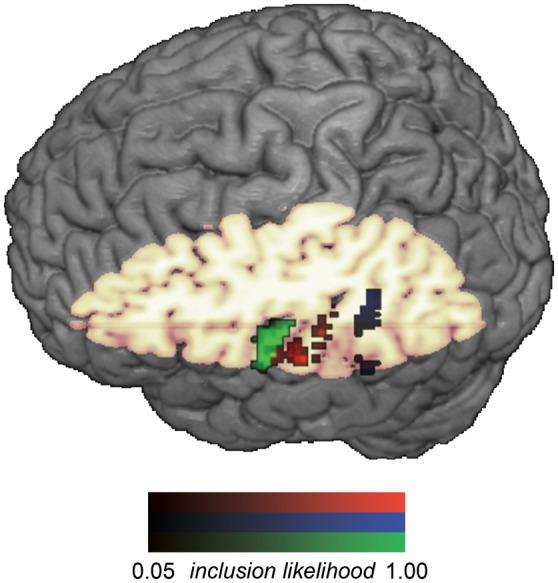
Probability map showing the voxelwise inclusion likelihood across participants for the intersection of unimodal (i.e., both AA and VV) congruency effect ROIs in functionally defined HG (green), PT (red). Probability map for pSTS (blue) depicts inclusion likelihood within the union of unimodal (i.e., either AA or VV) congruency effects. Voxels with the darkest values were included in the ROIs for the fewest participants, whereas voxels with the brightest values were included in the ROIs for the most participants.