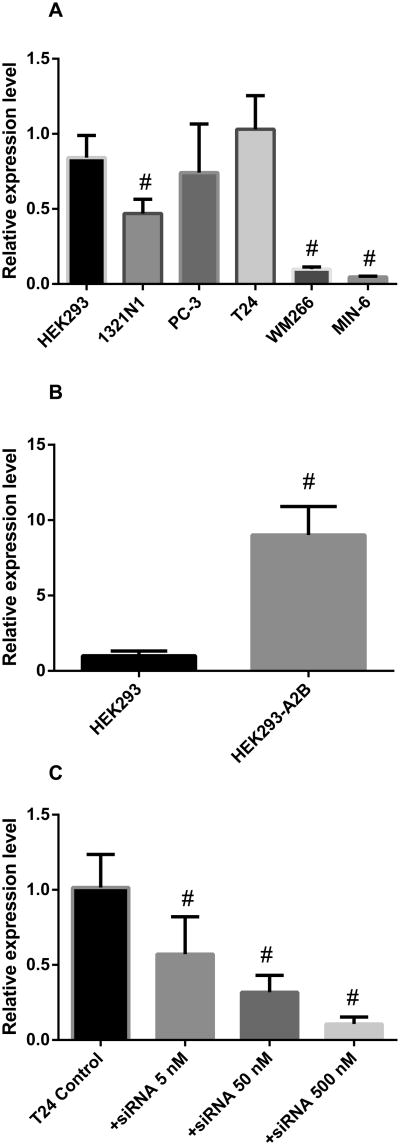
Fig. 6.
Quantification of A2BAR gene expression using qRT-PCR. A. A2BAR mRNA expression level in various cells. B. Comparison of the A2BAR gene expression levels of control HEK293 and A2B overexpressing HEK293 cells. C. A2BAR gene expression level in T24 cells in the absence and presence of various concentrations of A2BAR specific siRNA. All data were normalized based on endogenous GAPDH expression level and were expressed as relative expression level. Data were from 3-4 separate experiments providing similar results performed in triplicate. #Significantly different from T24 or HEK293 control groups (P<0.05 compared with control).

