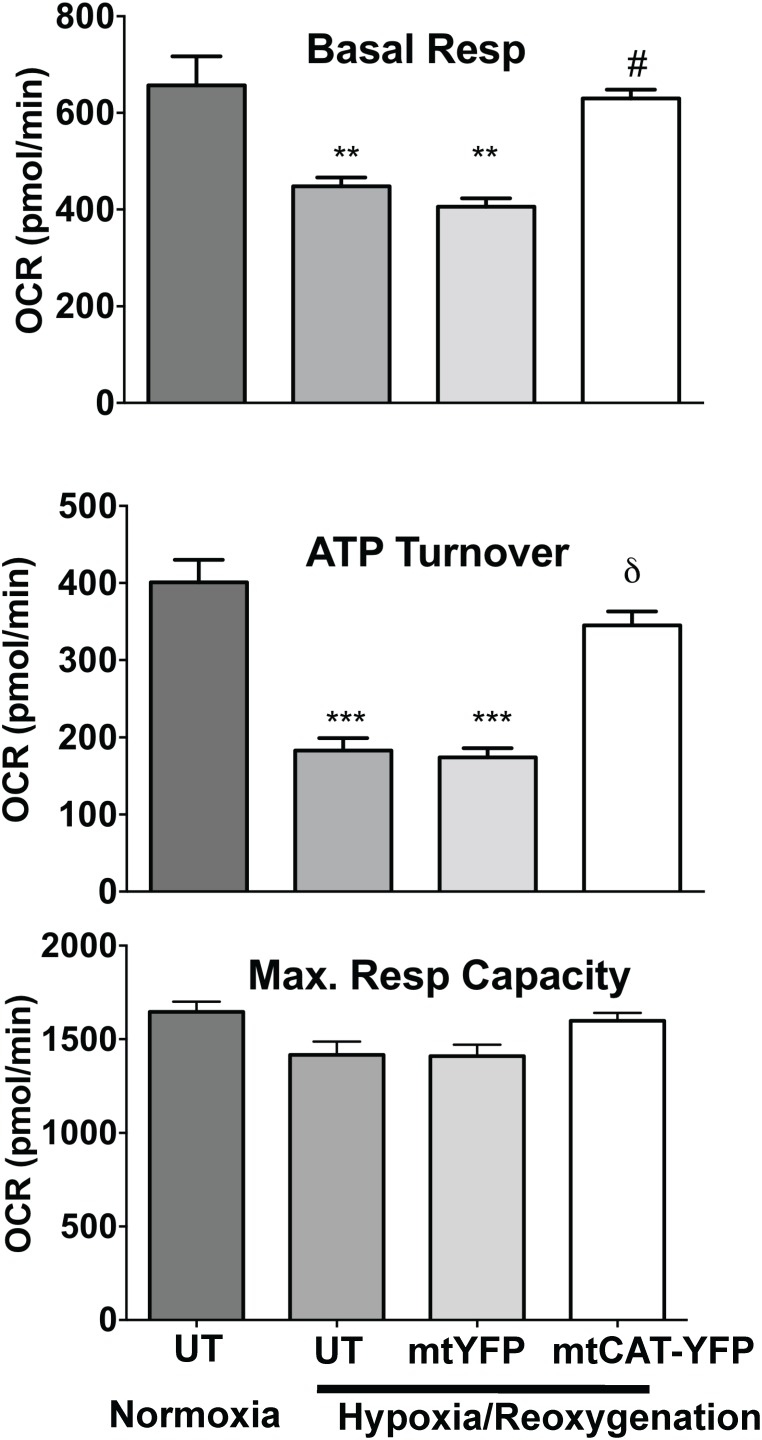
Figure 5. Bar graphs show oxygen consumption rates (OCR) due to basal respiration (top panel), OCR required for ATP turnover (mid panel) and maximal respiratory capacity (lower panel) as evaluated by oxygen consumption rates in isolated cardiomyocytes following hypoxia-reoxygenation.
Cells were control untransfected (UT) or transfected with CAT1-YFP-MTS or YFP-MTS AAV6 for 72 hr then subjected to 3 hr hypoxia-2 hr reoxygenation. Data is presented as mean ± SEM. **p<0.01 and ***p<0.001 vs. non-transfected normoxic controls; δ p<0.05 and #p<0.01 vs. non-transfected hypoxia-reoxygenated NVCMs.

