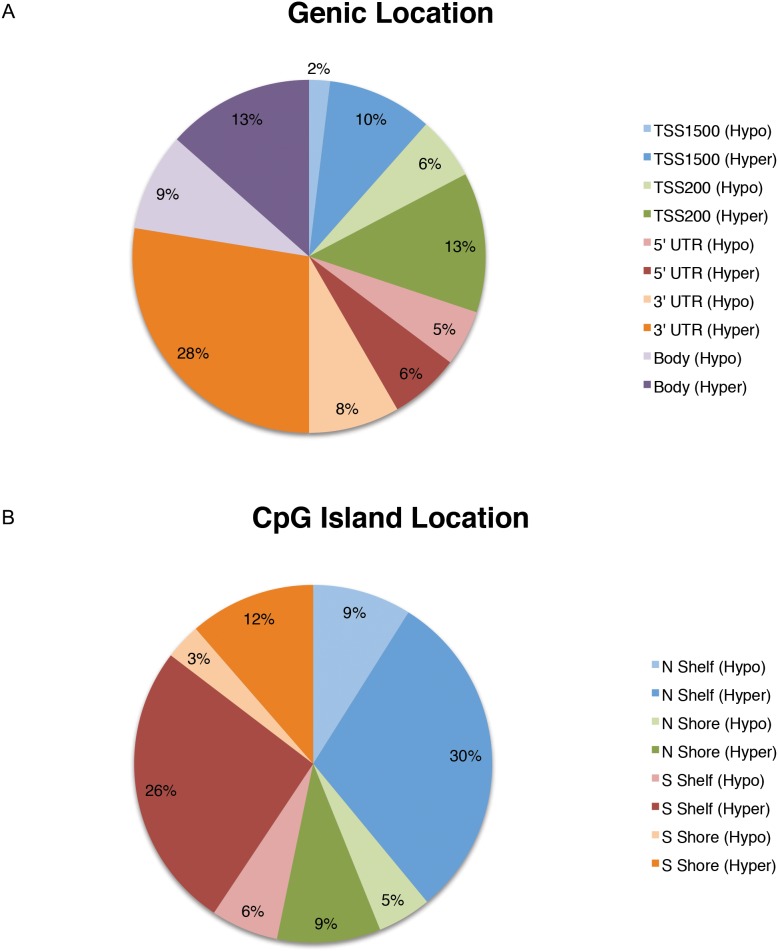
Figure 1. Distribution of differentially methylated regions in CFS.
Distribution of hyper- and hypo-methylated CpG regions in CFS patients compared to healthy control subjects according to (a) genic location 1500 bp and 200 bp relative to the transcription start site (TSS), in the 5′ UTR, 3′ UTR, and within gene bodies and (b) location relative to CpG islands, including 2 kb upstream and downstream of CpG islands (N, S Shore respectively), and 2 kb upstream and downstream of CpG shores (N, S Shelf respectively). No significant differences were found within CpG islands.

