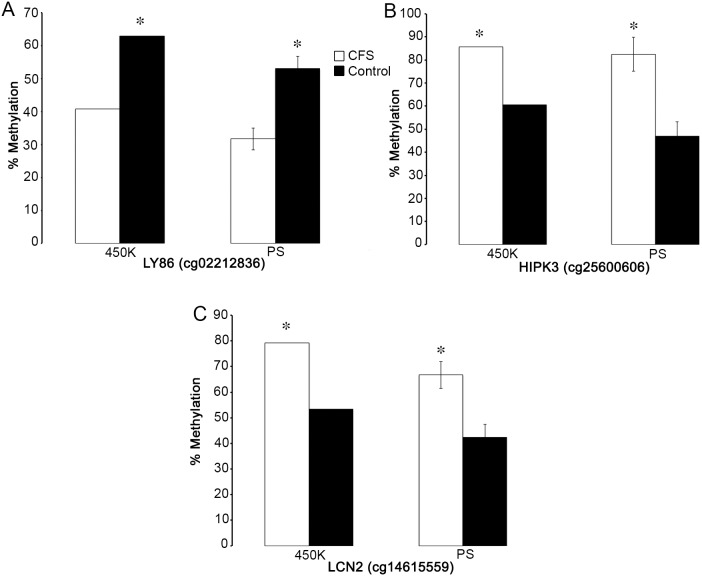
Figure 2. Validation of microarray data by pyrosequencing.
Validation of significant methylation differences identified by microarray (450 K) by pyrosequencing (PS), showing the average methylation level of CpG sites within the following genes (probe ID, genic location): (a) LY86 (cg02212836, first exon), (b) HIPK3 (cg25600606, gene body), and (c) LCN2 (cg14615559, TSS200). * = FDR<0.05, 450 K; * = p<0.05, PS, Wilcoxon rank-sum test. Error bars represent the standard error of the mean.

