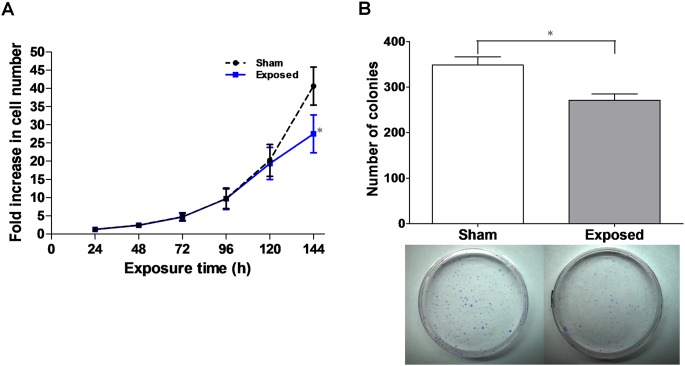
Figure 1. ELF-EMF inhibited cell growth and decreased cell colony formation.
(A) Growth curves of HaCaT cells for the sham (•) and exposed (▪) groups. The HaCaT cells were seeded and incubated for 12 h prior to ELF-EMF exposure. The results were presented as the mean ± SD fold change in the cell count relative to the initial cell count of three independent experiments. (B) Colony formation assay. In the upper panel, the bars show the colony formation of the sham and exposed cells for 144 h of ELF-EMF exposure. The results are presented as the mean ± SD of three independent experiments. In the lower panel, they were representative for sham (left) and exposed (right). The Student’s t-test was used to analyze the differences between the sham and exposure groups. *P<0.05.

