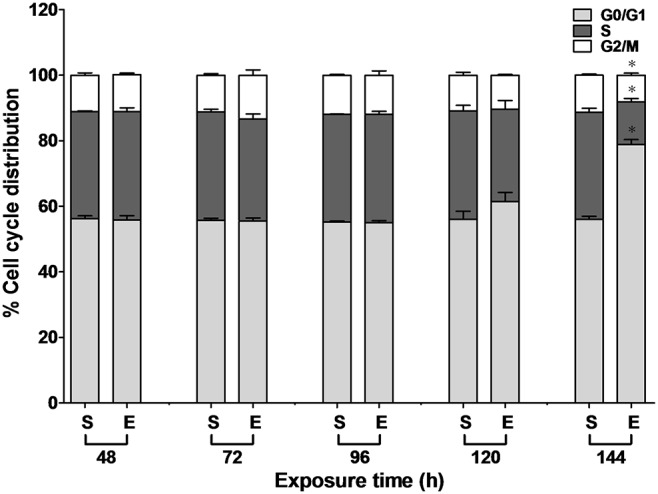
Figure 2. Cell cycle distribution in the sham (S) and exposed (E) HaCaT cells under ELF-EMF exposure.

HaCaT cells were exposed to ELF-EMF for 48 to 144 h and analyzed by PI staining and flow cytometry. The percentage of the cell cycle growth phases were represented as the mean ± SD of three independent experiments. The Student’s t-test was used to analyze the differences between the sham and exposure groups. *P<0.05.
