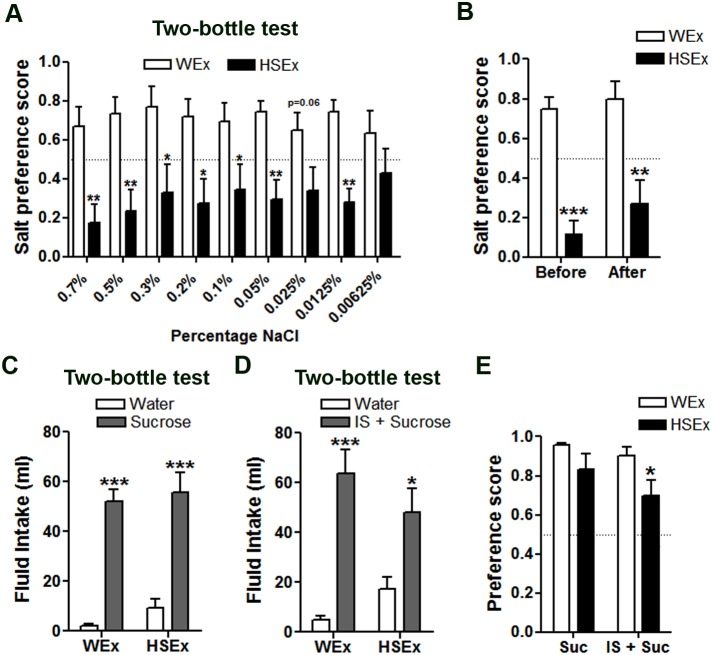
Figure 3. A significantly reduced appetite for salt solutions following a single 24 h one-bottle test with HS.
A, Mean preference scores have been calculated from 24 h measures of water and salt intake at the percentage shown for WEx and HSEx rats. B, mean preference score for IS on day 9 (before tests) and day 30 (after tests). C, mean intakes of 1% sucrose solution compared to water in 24 h two-bottle choice test. D, mean intakes of 1% sucrose prepared in IS in 24 h two-bottle choice test with water. E, mean preference scores calculated from the fluid intake data in C and D. Values are means +SEM of n = 8 animals per group. *p<0.05, **p<0.01, ***p<0.001. HS, hypertonic saline. HSEx, hypertonic saline exposed; IS, isotonic saline; Suc, sucrose; WEx, water exposed.

