
Figure 4. AQP2 expression in homogenates of the renal outer medulla.
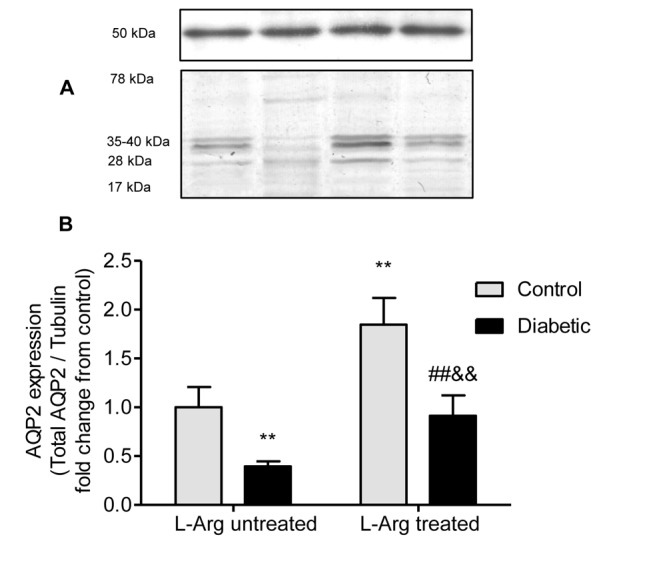
A. epresentative western blot analysis of AQP2 (28 and 35–40 kDa bands; unglycosylated and glycosylated forms respectively) and tubulin (50 kDa band) in the renal outer medulla. B. AQP2 expression indicated as the ratio AQP2/tubulin fold change from control untreated rats. Two-way ANOVA showed no statistically significant interaction between the effects of Diabetes and L-Arg treatment on the expression of AQP2. The effects of Diabetes and L-Arg on AQP2 expression were considered very significant (p<0.01). **p<0.01 vs. control untreated rats; ##p<0.01 vs. control rats treated with L-Arg, &&p<0.01 vs. diabetic untreated rats. Data are mean ± SEM (n = 6).